We've been asking ourselves recently if the market has placed a fair valuation on VICI Properties. Let's dive into some of the fundamental values of this Large-Cap Real Estate company to determine if there might be an opportunity here for value-minded investors.
VICI Properties Is Potentially Undervalued and Its Shares Are on Sale:
VICI Properties Inc. is an S&P 500 experiential real estate investment trust that owns one of the largest portfolios of market-leading gaming, hospitality, wellness, entertainment and leisure destinations, including Caesars Palace Las Vegas, MGM Grand and the Venetian Resort Las Vegas, three of the most iconic entertainment facilities on the Las Vegas Strip. The company belongs to the Real Estate sector, which has an average price to earnings (P/E) ratio of 27.31 and an average price to book (P/B) ratio of 1.94. In contrast, VICI Properties has a trailing 12 month P/E ratio of 11.8 and a P/B ratio of 1.21.
VICI Properties has moved -5.3% over the last year compared to 13.8% for the S&P 500 — a difference of -19.1%. VICI Properties has a 52 week high of $34.03 and a 52 week low of $27.98.
Exceptional Profitability Overshadowed by Excessive Leverage:
| 2019 | 2020 | 2021 | 2022 | 2023 | 2024 | |
|---|---|---|---|---|---|---|
| Revenue (M) | $895 | $1,226 | $1,510 | $2,601 | $3,612 | $3,849 |
| Operating Margins | 6% | 73% | 68% | 44% | 71% | 71% |
| Net Margins | 61% | 73% | 67% | 43% | 70% | 70% |
| Net Income (M) | $546 | $892 | $1,014 | $1,118 | $2,514 | $2,679 |
| Net Interest Expense (M) | $248 | $309 | $392 | $540 | $818 | $781 |
| Depreciation & Amort. (M) | $4 | $4 | $3 | $3 | $4 | $4 |
| Diluted Shares (M) | 439 | 511 | 577 | 880 | 1,016 | 1,048 |
| Earnings Per Share | $1.24 | $1.75 | $1.76 | $1.27 | $2.47 | $2.56 |
| EPS Growth | n/a | 41.12903225806452% | 0.571428571428572% | -27.84090909090909% | 94.48818897637796% | 3.6437246963562693% |
| Avg. Price | $18.12 | $19.06 | $26.56 | $27.02 | $31.88 | $30.73 |
| P/E Ratio | 14.5 | 10.83 | 14.76 | 21.28 | 12.85 | 12.0 |
| Free Cash Flow (M) | $679 | $881 | $894 | $1,942 | $2,177 | $2,374 |
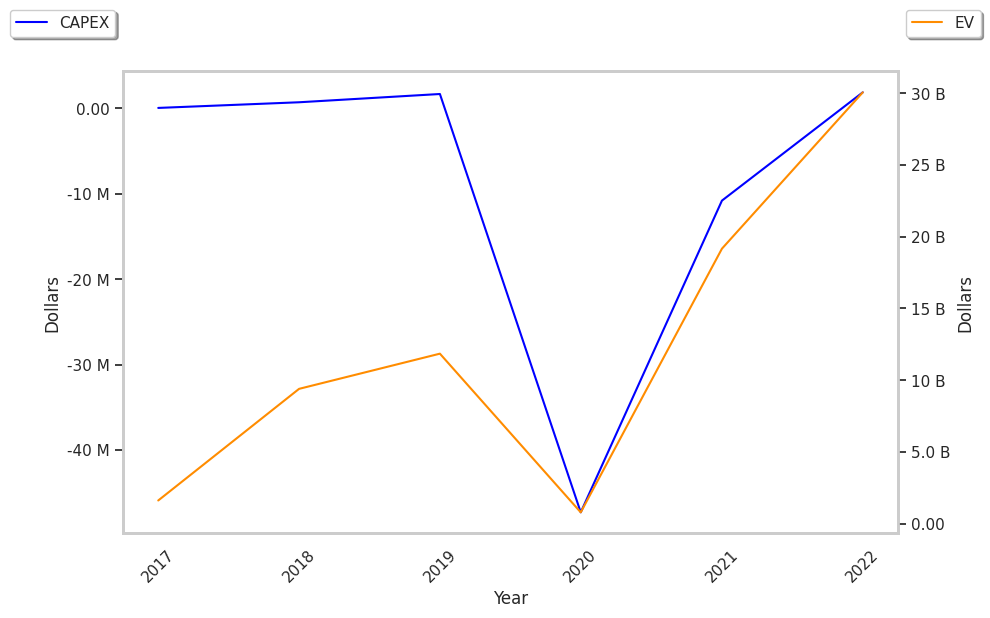
| CAPEX (M) | $3 | $3 | $3 | $2 | $4 | $8 |
| EV / EBITDA | 196.39 | 17.07 | 17.69 | 29.55 | 18.88 | 17.64 |
| Total Debt (M) | $4,792 | $6,766 | $4,695 | $13,740 | $16,724 | $16,733 |
| Net Debt / EBITDA | 65.73 | 7.16 | 3.84 | 11.84 | 6.35 | 5.93 |
VICI Properties has rapidly growing revenues and increasing reinvestment in the business and strong operating margins with a positive growth rate. Additionally, the company's financial statements display generally positive cash flows and a strong EPS growth trend. However, the firm has a highly leveraged balance sheet.