Today we're going to take a closer look at Large-Cap Finance company Capital One Financial, whose shares are currently trading at $212.91. We've been asking ourselves whether the company is under or over valued at today's prices... let's perform a brief value analysis to find out!
Capital One Financial's Valuation Is in Line With Its Sector Averages:
Capital One Financial Corporation operates as the financial services holding company for the Capital One, National Association, which engages in the provision of various financial products and services in the United States, Canada, and the United Kingdom. The company belongs to the Finance sector, which has an average price to earnings (P/E) ratio of 15.92 and an average price to book (P/B) ratio of 1.78. In contrast, Capital One Financial has a trailing 12 month P/E ratio of 591.4 and a P/B ratio of 1.29.
Capital One Financial has moved 34.6% over the last year compared to 13.8% for the S&P 500 — a difference of 20.8%. Capital One Financial has a 52 week high of $232.45 and a 52 week low of $143.22.
Increasing Revenues but Narrowing Margins:
| 2019 | 2020 | 2021 | 2022 | 2023 | 2024 | |
|---|---|---|---|---|---|---|
| Revenue (M) | $28,513 | $26,033 | $25,769 | $31,237 | $41,938 | $39,112 |
| Interest Income (M) | $23,340 | $22,913 | $24,171 | $27,114 | $29,241 | $31,208 |
| Operating Margins | 24% | 12% | 61% | 30% | 14% | 15% |
| Net Margins | 19% | 10% | 48% | 24% | 12% | 12% |
| Net Income (M) | $5,546 | $2,714 | $12,390 | $7,360 | $4,887 | $4,750 |
| Depreciation & Amort. (M) | $3,339 | $3,501 | $3,481 | $3,210 | $3,226 | $3,237 |
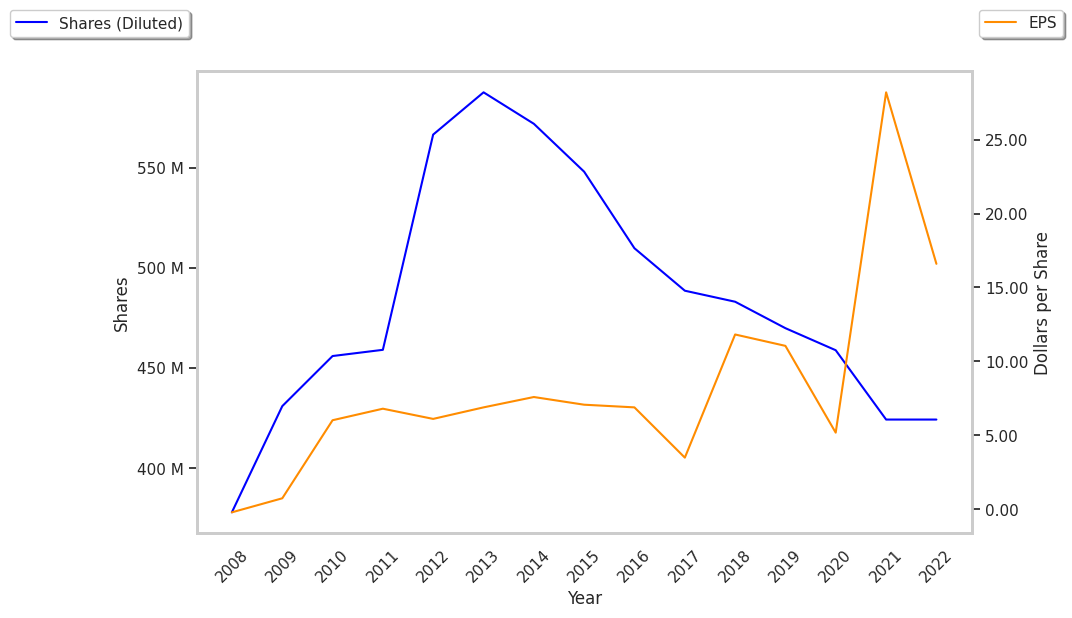
| Diluted Shares (M) | 230 | 110 | 444 | 393 | 383 | 384 |
| Earnings Per Share | $11.05 | $5.18 | $26.94 | $17.91 | $11.95 | $11.59 |
| EPS Growth | n/a | -53.12% | 420.08% | -33.52% | -33.28% | -3.01% |
| Avg. Price | $83.33 | $71.55 | $141.14 | $129.38 | $131.12 | $211.34 |
| P/E Ratio | 7.51 | 13.79 | 5.22 | 7.2 | 10.94 | 18.2 |
| Free Cash Flow (M) | $15,752 | $15,989 | $11,612 | $12,875 | $19,614 | $16,955 |
| CAPEX (M) | $887 | $710 | $698 | $934 | $961 | $1,204 |
| EV / EBITDA | 7.24 | 4.78 | 4.41 | 5.63 | 5.99 | 8.93 |
| Total Debt (M) | $48,383 | $39,871 | $42,266 | $47,832 | $49,318 | $44,989 |
| Net Debt / EBITDA | 3.42 | -0.1 | 1.05 | 1.33 | 0.6 | 0.14 |
Capital One Financial has growing revenues and increasing reinvestment in the business and low leverage levels. Additionally, the company's financial statements display positive EPS growth and generally positive cash flows. However, the firm has weak net margins with a negative growth trend.