Now trading at a price of $81.4, DuPont de Nemours has moved 0.6% so far today.
Over the last year, DuPont de Nemours logged a -4.6% change, with its stock price reaching a high of $87.8 and a low of $53.77. Over the same period, the stock underperformed the S&P 500 index by -19.7%. AThe company's 50-day average price was $76.77. DuPont de Nemours, Inc. provides technology-based materials and solutions in the United States, Canada, the Asia Pacific, Latin America, Europe, the Middle East, and Africa. Based in Wilmington, DE, the Large-Cap Industrials company has 24,000 full time employees. DuPont de Nemours has offered a 2.0% dividend yield over the last 12 months.
EPS Growth Achieved Primarily Through Stock Repurchases:
| 2019 | 2020 | 2021 | 2022 | 2023 | 2024 | |
|---|---|---|---|---|---|---|
| Revenue (M) | $15,436 | $14,338 | $12,566 | $13,017 | $12,068 | $12,386 |
| Operating Margins | -1% | -9% | 11% | 11% | 4% | 10% |
| Net Margins | 4% | -20% | 51% | 45% | 4% | 6% |
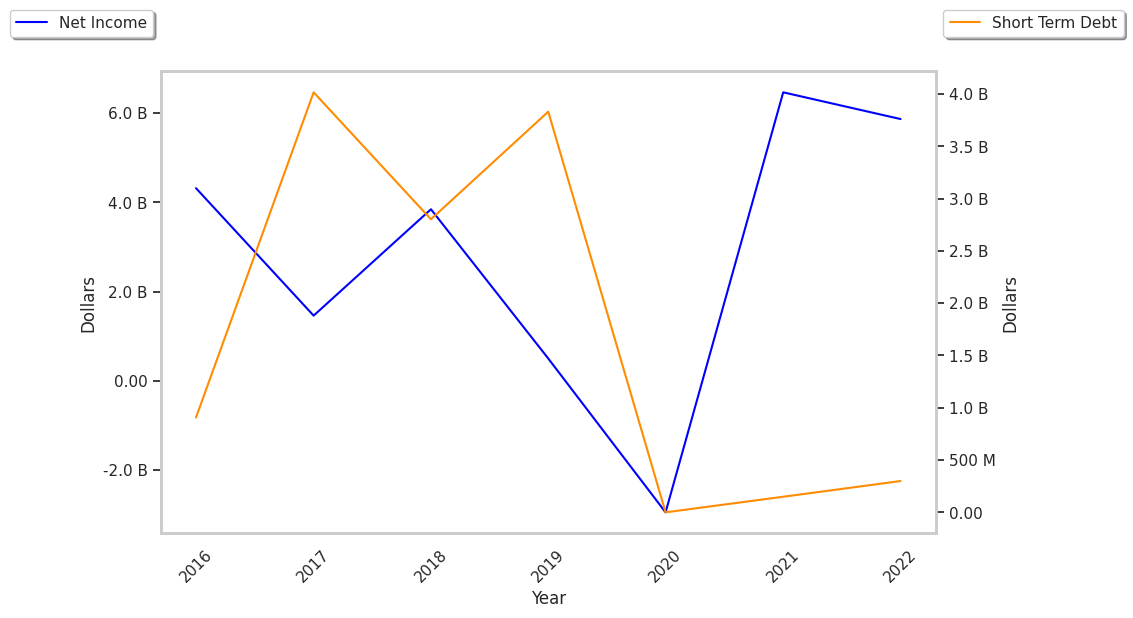
| Net Income (M) | $600 | -$2,923 | $6,467 | $5,868 | $423 | $703 |
| Net Interest Expense (M) | $667 | $672 | $525 | $492 | $396 | $366 |
| Depreciation & Amort. (M) | $3,195 | $3,094 | $1,112 | $1,135 | $1,147 | $599 |
| Diluted Shares (M) | 7,463 | 736 | 544 | 499 | 451 | 421 |
| Earnings Per Share | $0.67 | -$4.01 | $11.89 | $11.75 | $0.94 | $1.67 |
| EPS Growth | n/a | -698.51% | 396.51% | -1.18% | -92.0% | 77.66% |
| Avg. Price | $79.02 | $50.61 | $73.69 | $69.04 | $76.93 | $80.95 |
| P/E Ratio | 117.94 | -12.62 | 6.18 | 5.87 | 81.84 | 48.18 |
| Free Cash Flow (M) | -$1,089 | $1,029 | $1,493 | -$74 | n/a | $1,742 |
| CAPEX (M) | $2,472 | $272 | $788 | $662 | $619 | $579 |
| EV / EBITDA | 63.23 | 27.51 | 18.96 | 15.42 | 24.63 | 22.88 |
| Total Debt (M) | $17,436 | $15,612 | $10,782 | $8,074 | $7,800 | $9,018 |
| Net Debt / EBITDA | 5.18 | 7.12 | 3.45 | 1.71 | 3.28 | 4.0 |
| Current Ratio | 1.2 | 2.37 | 2.9 | 3.02 | 2.43 | 1.33 |
DuPont de Nemours has declining revenues and decreasing reinvestment in the business, good EPS growth resulting mainly from stock repurchases, and a highly leveraged balance sheet. On the other hand, the company has positive cash flows working in its favor. Furthermore, DuPont de Nemours has weak operating margins with a positive growth rate and just enough current assets to cover current liabilities, as shown by its current ratio of 1.33.
a Lower P/B Ratio Than Its Sector Average but Its Shares Are Expensive:
DuPont de Nemours has a trailing twelve month P/E ratio of 451.6, compared to an average of 24.03 for the Industrials sector. Based on its EPS guidance of $4.39, the company has a forward P/E ratio of 17.5. DuPont de Nemours's PEG ratio is 26.65 on the basis of the 16.9% weighted average of the company and the broader market's EPS compound average growth rates. This suggests that the company's shares are overvalued. In contrast, the market is likely undervaluing DuPont de Nemours in terms of its equity because its P/B ratio is 1.48 while the sector average is 2.89. The company's shares are currently trading 78.2% below their Graham number.
DuPont de Nemours Has an Average Rating of Buy:
The 16 analysts following DuPont de Nemours have set target prices ranging from $80.0 to $114.0 per share, for an average of $93.81 with a buy rating. The company is trading -13.2% away from its average target price, indicating that there is an analyst consensus of some upside potential.
DuPont de Nemours has an average amount of shares sold short because 2.0% of the company's shares are sold short. Institutions own 74.3% of the company's shares, and the insider ownership rate stands at 0.21%, suggesting a small amount of insider investors. The largest shareholder is Vanguard Group Inc, whose 11% stake in the company is worth $3,879,867,824.