Now trading at a price of $67.65, Fidelity National Information Services has moved -0.4% so far today.
Fidelity National Information Services returned losses of -24.1% last year, with its stock price reaching a high of $91.98 and a low of $63.0. Over the same period, the stock underperformed the S&P 500 index by -39.2%. AThe company's 50-day average price was $67.89. Fidelity National Information Services, Inc. engages in the provision of financial services technology solutions for financial institutions, businesses, and developers worldwide. Based in Jacksonville, FL, the Large-Cap Real Estate company has 50,000 full time employees. Fidelity National Information Services has offered a 2.2% dividend yield over the last 12 months.
The Company's Revenues Are Declining:
| 2019 | 2020 | 2021 | 2022 | 2023 | 2024 | |
|---|---|---|---|---|---|---|
| Revenue (M) | $10,333 | $12,552 | $9,339 | $9,720 | $9,831 | $10,127 |
| Gross Margins | 36% | 33% | 36% | 36% | 37% | 38% |
| Net Margins | 3% | 1% | 4% | -172% | -68% | 14% |
| Net Income (M) | $303 | $158 | $417 | -$16,752 | -$6,655 | $1,450 |
| Net Interest Expense (M) | $389 | $339 | $214 | $298 | $713 | $396 |
| Depreciation & Amort. (M) | $2,444 | $3,714 | $4,015 | $1,878 | $1,744 | $1,737 |
| Diluted Shares (M) | 451 | 627 | 621 | 593 | 591 | 540 |
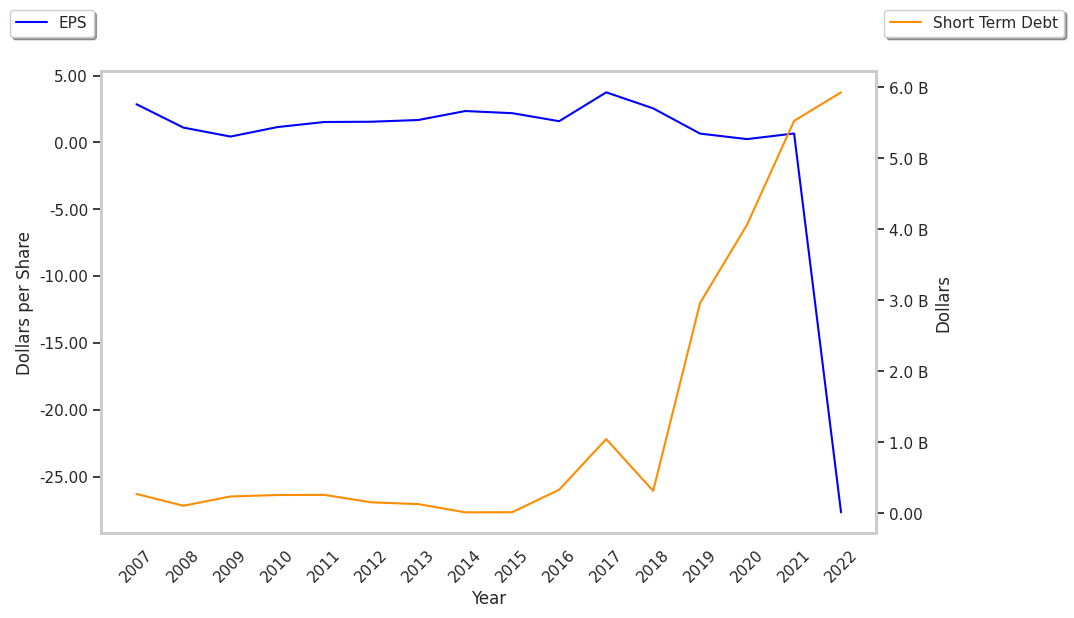
| Earnings Per Share | $0.66 | $0.25 | $0.67 | -$27.74 | -$11.26 | $2.61 |
| EPS Growth | n/a | -62.12% | 168.0% | -4240.3% | 59.41% | 123.18% |
| Avg. Price | $114.8 | $131.55 | $126.75 | $98.04 | $60.07 | $67.94 |
| P/E Ratio | 171.34 | 505.96 | 186.4 | -3.53 | -5.33 | 25.93 |
| Free Cash Flow (M) | $2,210 | $4,179 | $4,490 | $3,712 | $4,220 | $2,078 |
| CAPEX (M) | $200 | $263 | $320 | $227 | $115 | $97 |
| EV / EBITDA | 20.62 | 26.02 | 21.04 | 28.72 | 19.13 | 17.03 |
| Total Debt (M) | $34,458 | $31,902 | $29,650 | $28,413 | $25,940 | $20,340 |
| Net Debt / EBITDA | 9.76 | 7.02 | 5.47 | 9.15 | 7.99 | 5.66 |
| Current Ratio | 0.84 | 0.8 | 0.74 | 0.79 | 0.75 | 0.85 |
Fidelity National Information Services's financial statements include several red flags such as declining revenues and decreasing reinvestment in the business, positive cash flows, and not enough current assets to cover current liabilities because its current ratio is 0.85. Additionally, the firm has a highly leveraged balance sheet. On the other hand, the company benefits from wider gross margins than its peer group and a strong EPS growth trend.
Fidelity National Information Services's Valuation Is in Line With Its Sector Averages:
Fidelity National Information Services has a trailing twelve month P/E ratio of 271.6, compared to an average of 27.31 for the Real Estate sector. Based on its EPS guidance of $5.71, the company has a forward P/E ratio of 11.9. Fidelity National Information Services's PEG ratio is 14.86 on the basis of the 18.3% weighted average of the company and the broader market's EPS compound average growth rates. This suggests that the company's shares are overvalued. Furthermore, Fidelity National Information Services is likely overvalued compared to the book value of its equity, since its P/B ratio of 2.5 is higher than the sector average of 1.94. The company's shares are currently trading 63.7% below their Graham number.
Fidelity National Information Services Has an Average Rating of Buy:
The 18 analysts following Fidelity National Information Services have set target prices ranging from $70.0 to $93.0 per share, for an average of $84.39 with a buy rating. The company is trading -19.8% away from its average target price, indicating that there is an analyst consensus of some upside potential.
Fidelity National Information Services has an average amount of shares sold short because 2.5% of the company's shares are sold short. Institutions own 100.9% of the company's shares, and the insider ownership rate stands at 0.13%, suggesting a small amount of insider investors. The largest shareholder is Vanguard Group Inc, whose 12% stake in the company is worth $4,263,257,297.