We've been asking ourselves recently if the market has placed a fair valuation on Progressive. Let's dive into some of the fundamental values of this Large-Cap Finance company to determine if there might be an opportunity here for value-minded investors.
a Decline in Expected Earnings Clouds Its Value Outlook but Its Shares Are Expensive:
The Progressive Corporation operates as an insurance company in the United States. The company belongs to the Finance sector, which has an average price to earnings (P/E) ratio of 15.92 and an average price to book (P/B) ratio of 1.78. In contrast, Progressive has a trailing 12 month P/E ratio of 12.1 and a P/B ratio of 3.64.
Progressive has moved -11.6% over the last year compared to 15.1% for the S&P 500 — a difference of -26.7%. Progressive has a 52 week high of $292.99 and a 52 week low of $217.2.
Generally Positive Cash Flows and Good EPS Growth:
| 2019 | 2020 | 2021 | 2022 | 2023 | 2024 | |
|---|---|---|---|---|---|---|
| Revenue (M) | $39,022 | $42,658 | $47,702 | $49,611 | $62,109 | $75,372 |
| Interest Income (M) | $190 | $217 | $219 | $244 | $268 | $279 |
| Operating Margins | 13% | 17% | 9% | 2% | 8% | 14% |
| Net Margins | 10% | 13% | 7% | 1% | 6% | 11% |
| Net Income (M) | $3,970 | $5,705 | $3,351 | $722 | $3,903 | $8,480 |
| Depreciation & Amort. (M) | $240 | $275 | $280 | $306 | $285 | $284 |
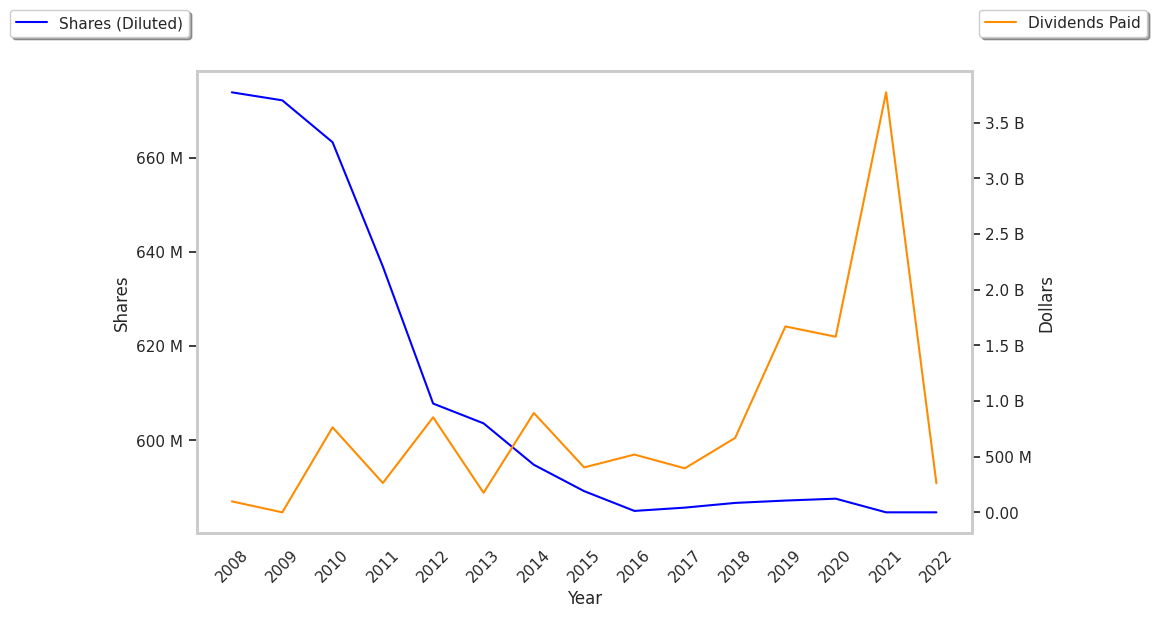
| Diluted Shares (M) | 587 | 588 | 587 | 587 | 588 | 588 |
| Earnings Per Share | $6.72 | $9.66 | $5.66 | $1.18 | $6.58 | $14.4 |
| EPS Growth | n/a | 43.75% | -41.41% | -79.15% | 457.63% | 118.84% |
| Avg. Price | $66.42 | $79.01 | $93.11 | $110.63 | $159.28 | $219.38 |
| P/E Ratio | 9.84 | 8.14 | 16.36 | 92.97 | 24.1 | 15.18 |
| Free Cash Flow (M) | $5,898 | $6,682 | $7,518 | $6,557 | $10,391 | $14,834 |
| CAPEX (M) | $364 | $224 | $244 | $292 | $252 | $285 |
| EV / EBITDA | 7.96 | 6.92 | 13.19 | 57.71 | 19.28 | 12.3 |
| Total Debt (M) | $4,407 | $5,396 | $4,899 | $6,388 | $6,889 | $6,893 |
| Net Debt / EBITDA | 0.77 | 0.71 | 1.05 | 5.02 | 1.31 | 0.61 |
Progressive has generally positive cash flows and low leverage levels. Additionally, the company's financial statements display rapidly growing revenues and decreasing reinvestment in the business and a strong EPS growth trend. However, the firm has weak operating margins with a stable trend.