Today we're going to take a closer look at Large-Cap Real Estate company Ventas, whose shares are currently trading at $70.47. We've been asking ourselves whether the company is under or over valued at today's prices... let's perform a brief value analysis to find out!
Ventas's Valuation Is in Line With Its Sector Averages:
Ventas, Inc. (NYSE: VTR) is a leading S&P 500 real estate investment trust enabling exceptional environments that benefit a large and growing aging population. The company belongs to the Real Estate sector, which has an average price to earnings (P/E) ratio of 27.31 and an average price to book (P/B) ratio of 1.94. In contrast, Ventas has a trailing 12 month P/E ratio of 163.9 and a P/B ratio of 2.77.
Ventas has moved 6.7% over the last year compared to 16.2% for the S&P 500 — a difference of -9.5%. Ventas has a 52 week high of $72.02 and a 52 week low of $56.68.
Increasing Revenues but Narrowing Margins:
| 2019 | 2020 | 2021 | 2022 | 2023 | 2024 | |
|---|---|---|---|---|---|---|
| Revenue (M) | $3,873 | $3,795 | $3,828 | $4,129 | $4,498 | $4,924 |
| Operating Margins | 11% | 2% | -4% | -2% | -3% | 0% |
| Net Margins | 11% | 12% | 1% | -1% | -1% | 2% |
| Net Income (M) | $439 | $441 | $57 | -$41 | -$30 | $88 |
| Net Interest Expense (M) | $452 | $470 | $440 | $468 | $574 | $603 |
| Depreciation & Amort. (M) | $1,046 | $1,110 | $1,197 | $1,198 | $1,392 | $1,253 |
| Diluted Shares (M) | 370 | 377 | 386 | 403 | 406 | 416 |
| Earnings Per Share | $1.17 | $1.17 | $0.13 | -$0.12 | -$0.1 | $0.19 |
| EPS Growth | n/a | 0.0% | -88.89% | -192.31% | 16.67% | 290.0% |
| Avg. Price | $54.27 | $37.4 | $50.17 | $52.34 | $49.84 | $70.24 |
| P/E Ratio | 45.99 | 31.69 | 385.92 | -436.17 | -498.4 | 351.2 |
| Free Cash Flow (M) | $1,281 | $1,070 | $778 | $888 | $736 | -$1,030 |
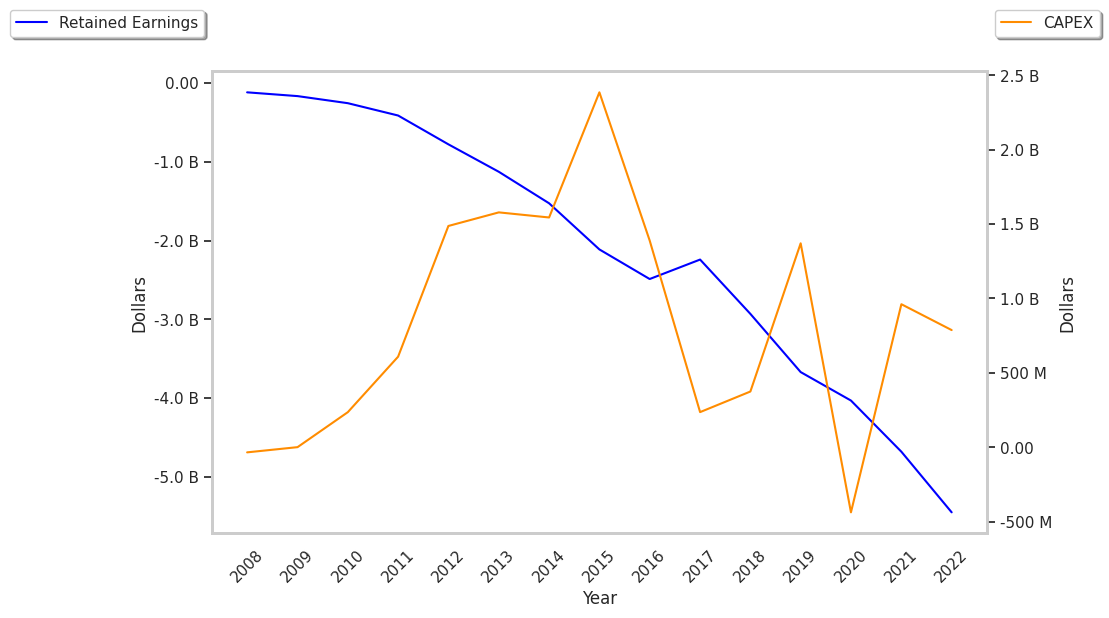
| CAPEX (M) | $157 | $380 | $248 | $232 | $384 | $2,360 |
| EV / EBITDA | 21.15 | 21.36 | 29.64 | 29.98 | 25.78 | 32.84 |
| Total Debt (M) | $12,159 | $11,895 | $12,028 | $12,297 | $13,491 | $13,523 |
| Net Debt / EBITDA | 8.12 | 9.65 | 11.48 | 11.03 | 10.17 | 10.14 |
Ventas's financial statements include several red flags such as weak operating margins with a unknown rate of growth, declining EPS growth, and positive cash flows. Additionally, the firm has a highly leveraged balance sheet. On the other hand, the company has growing revenues and increasing reinvestment in the business working in its favor.