We've been asking ourselves recently if the market has placed a fair valuation on Williams. Let's dive into some of the fundamental values of this Large-Cap Utilities company to determine if there might be an opportunity here for value-minded investors.
Williams's P/B and P/E Ratios Are Higher Than Average:
The Williams Companies, Inc., together with its subsidiaries, operates as an energy infrastructure company primarily in the United States. The company belongs to the Utilities sector, which has an average price to earnings (P/E) ratio of 21.16 and an average price to book (P/B) ratio of 2.36. In contrast, Williams has a trailing 12 month P/E ratio of 29.7 and a P/B ratio of 5.8.
Williams has moved 12.2% over the last year compared to 16.0% for the S&P 500 — a difference of -3.8%. Williams has a 52 week high of $65.55 and a 52 week low of $51.46.
Exceptional Profitability Overshadowed by Excessive Leverage:
| 2019 | 2020 | 2021 | 2022 | 2023 | 2024 | |
|---|---|---|---|---|---|---|
| Revenue (M) | $8,201 | $7,719 | $10,627 | $10,965 | $10,907 | $10,503 |
| Operating Margins | 23% | 28% | 25% | 28% | 40% | 32% |
| Net Margins | 10% | 3% | 14% | 19% | 28% | 21% |
| Net Income (M) | $850 | $211 | $1,517 | $2,049 | $3,179 | $2,225 |
| Net Interest Expense (M) | $1,186 | $1,172 | $1,179 | $1,147 | $1,236 | $108 |
| Depreciation & Amort. (M) | $1,714 | $1,721 | $1,842 | $2,009 | $2,071 | $1,800 |
| Diluted Shares (M) | 1,214 | 1,215 | 1,218 | 1,223 | 1,223 | 1,223 |
| Earnings Per Share | $0.7 | $0.17 | $1.24 | $1.67 | $2.6 | $1.82 |
| EPS Growth | n/a | -75.71% | 629.41% | 34.68% | 55.69% | -30.0% |
| Avg. Price | $19.6 | $16.26 | $22.57 | $30.27 | $34.83 | $58.93 |
| P/E Ratio | 28.0 | 95.65 | 18.06 | 18.02 | 13.34 | 32.38 |
| Free Cash Flow (M) | $1,584 | $2,257 | $2,706 | $2,636 | $3,422 | $2,401 |
| CAPEX (M) | $2,109 | $1,239 | $1,239 | $2,253 | $2,516 | $2,573 |
| EV / EBITDA | 11.99 | 10.46 | 10.59 | 11.65 | 9.99 | 18.75 |
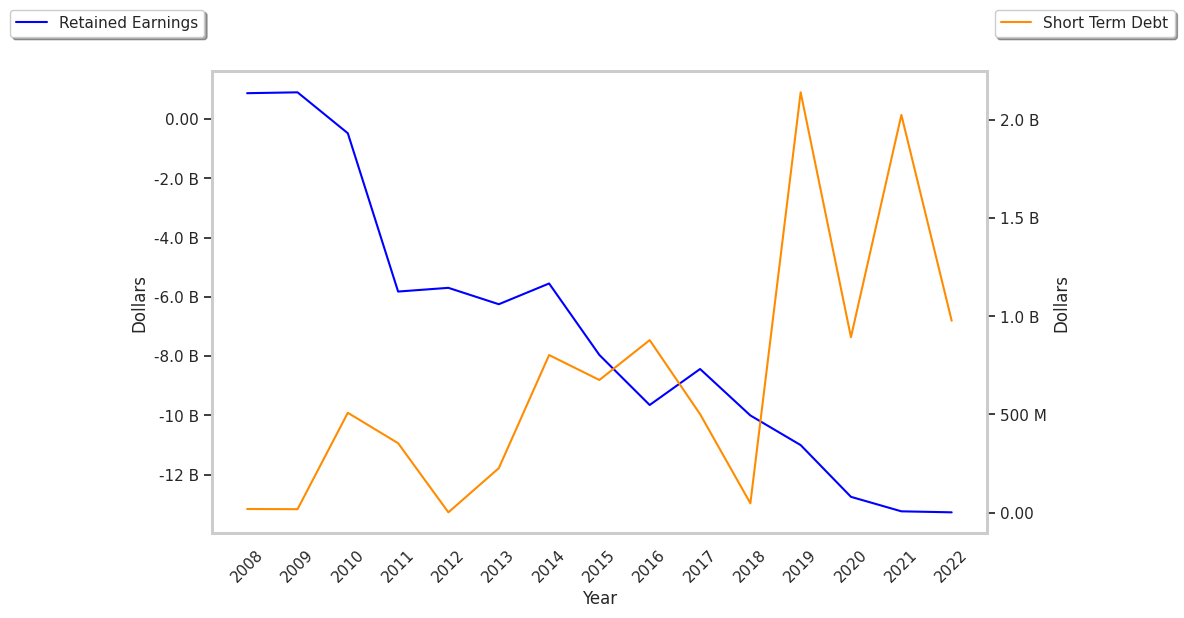
| Total Debt (M) | $20,148 | $21,451 | $21,650 | $21,927 | $23,376 | $24,736 |
| Net Debt / EBITDA | 5.46 | 5.43 | 4.46 | 4.33 | 3.34 | 4.8 |
| Current Ratio | 0.4 | 0.62 | 0.91 | 0.78 | 0.77 | 0.5 |
Williams has growing revenues and increasing reinvestment in the business and strong operating margins with a stable trend. Additionally, the company's financial statements display a strong EPS growth trend and generally positive cash flows. However, the firm suffers from not enough current assets to cover current liabilities because its current ratio is 0.5 and a highly leveraged balance sheet.