Now trading at a price of $307.25, International Business Machines has moved -0.1% so far today.
International Business Machines returned gains of 44.4% last year, with its stock price reaching a high of $310.75 and a low of $203.51. Over the same period, the stock outperformed the S&P 500 index by 27.8%. More recently, the company's 50-day average price was $266.1. International Business Machines Corporation, together with its subsidiaries, provides integrated solutions and services in the Americas, Europe, the Middle East, Africa, and the Asia Pacific. Based in Armonk, NY, the Large-Cap Technology company has 270,300 full time employees. International Business Machines has offered a 2.2% dividend yield over the last 12 months.
The Company's Revenues Are Declining:
| 2019 | 2020 | 2021 | 2022 | 2023 | 2024 | |
|---|---|---|---|---|---|---|
| Revenue (M) | $57,714 | $55,179 | $57,350 | $60,530 | $61,860 | $62,753 |
| Gross Margins | 55% | 56% | 55% | 54% | 55% | 56% |
| Net Margins | 16% | 10% | 10% | 3% | 12% | 10% |
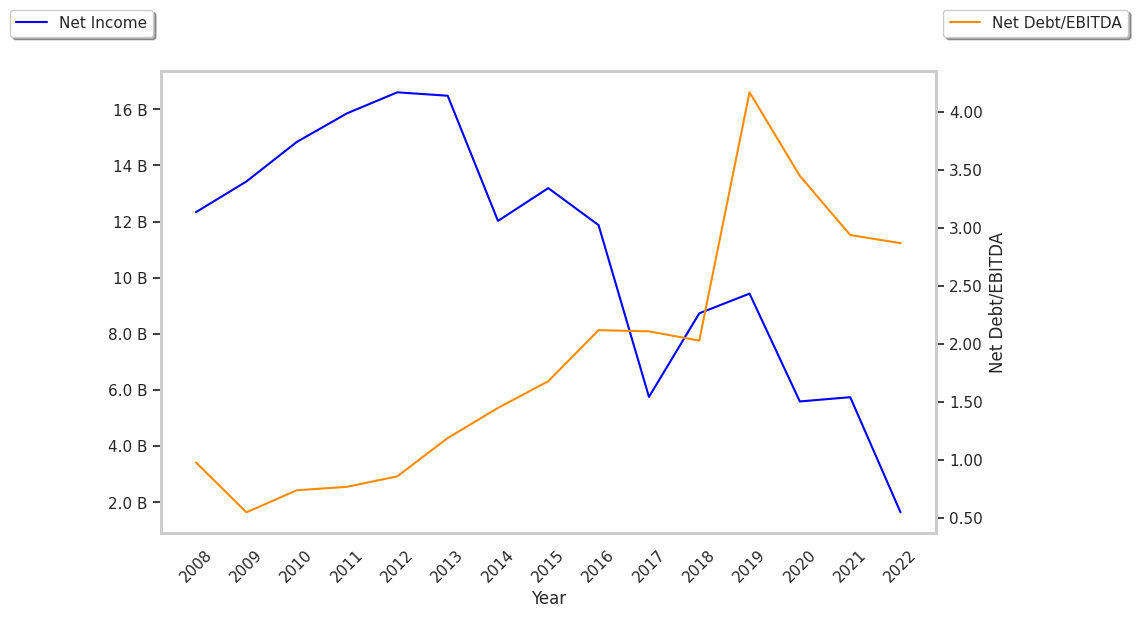
| Net Income (M) | $9,431 | $5,590 | $5,743 | $1,639 | $7,502 | $6,023 |
| Net Interest Expense (M) | $1,344 | $1,288 | $1,155 | $1,216 | $1,607 | $1,712 |
| Depreciation & Amort. (M) | $4,209 | $4,227 | $3,888 | $2,407 | $2,109 | $2,168 |
| Diluted Shares (M) | 893 | 897 | 905 | 912 | 922 | 937 |
| Earnings Per Share | $10.56 | $6.23 | $6.35 | $1.8 | $8.14 | $6.43 |
| EPS Growth | n/a | -41.0% | 1.93% | -71.65% | 352.22% | -21.01% |
| Avg. Price | $107.53 | $102.36 | $116.9 | $125.08 | $163.55 | $307.46 |
| P/E Ratio | 10.12 | 16.3 | 18.24 | 68.73 | 19.87 | 47.08 |
| Free Cash Flow (M) | $12,484 | $15,579 | $10,734 | $9,089 | $12,686 | $12,397 |
| CAPEX (M) | $2,286 | $2,618 | $2,062 | $1,346 | $1,245 | $1,048 |
| EV / EBITDA | 14.08 | 20.47 | 17.14 | 43.66 | 17.76 | 40.54 |
| Total Debt (M) | $73,194 | $61,400 | $51,704 | $50,949 | $56,547 | $54,973 |
| Net Debt / EBITDA | 5.7 | 7.09 | 5.16 | 12.09 | 4.03 | 5.15 |
| Current Ratio | 1.02 | 0.98 | 0.88 | 0.92 | 0.96 | 1.04 |
International Business Machines has slight revenue growth and decreasing reinvestment in the business, declining EPS growth, and a highly leveraged balance sheet. On the other hand, the company has wider gross margins than its peer group working in its favor. Furthermore, International Business Machines has positive cash flows and just enough current assets to cover current liabilities, as shown by its current ratio of 1.04.
International Business Machines's Valuation Is in Line With Its Sector Averages:
International Business Machines has a trailing twelve month P/E ratio of 31.7, compared to an average of 30.44 for the Technology sector. Based on its EPS guidance of $10.61, the company has a forward P/E ratio of 25.1. The 0.1% compound average growth rate of International Business Machines's historical and projected earnings per share yields a PEG ratio of 469.84. This suggests that these shares are overvalued. Furthermore, International Business Machines is likely overvalued compared to the book value of its equity, since its P/B ratio of 10.29 is higher than the sector average of 4.19. The company's shares are currently trading 373.2% below their Graham number. Ultimately, International Business Machines's strong cash flows, decent earnings multiple, and healthy debt levels factor towards it being fairly valued, its elevated P/B ratio notwithstanding.
International Business Machines Has an Average Rating of Hold:
The 18 analysts following International Business Machines have set target prices ranging from $198.0 to $350.0 per share, for an average of $285.59 with a hold rating. The company is trading 7.6% away from its average target price, indicating that there is an analyst consensus of little upside potential.
International Business Machines has a very low short interest because 1.9% of the company's shares are sold short. Institutions own 64.4% of the company's shares, and the insider ownership rate stands at 0.12%, suggesting a small amount of insider investors. The largest shareholder is Vanguard Group Inc, whose 10% stake in the company is worth $29,204,565,693.