We've been asking ourselves recently if the market has placed a fair valuation on Raymond James Financial. Let's dive into some of the fundamental values of this Large-Cap Finance company to determine if there might be an opportunity here for value-minded investors.
a Very Low P/E Ratio but Trading Above Its Fair Price:
Raymond James Financial, Inc., a diversified financial services company, provides private client group, capital markets, asset management, banking, and other services to individuals, corporations, and municipalities in the United States, Canada, and Europe. The company belongs to the Finance sector, which has an average price to earnings (P/E) ratio of 15.92 and an average price to book (P/B) ratio of 1.78. In contrast, Raymond James Financial has a trailing 12 month P/E ratio of 15.8 and a P/B ratio of 2.67.
Raymond James Financial has moved 9.6% over the last year compared to 16.6% for the S&P 500 — a difference of -7.0%. Raymond James Financial has a 52 week high of $177.66 and a 52 week low of $117.57.
Strong Revenue Growth but Positive Cash Flows:
| 2019 | 2020 | 2021 | 2022 | 2023 | 2024 | |
|---|---|---|---|---|---|---|
| Revenue (M) | $8,023 | $8,168 | $9,910 | $11,308 | $12,992 | $14,923 |
| Interest Income (M) | $998 | $822 | $673 | $1,203 | $2,375 | $2,130 |
| Net Margins | 13% | 10% | 14% | 13% | 13% | 14% |
| Net Income (M) | $1,034 | $818 | $1,403 | $1,509 | $1,739 | $2,068 |
| Depreciation & Amort. (M) | $112 | $119 | $134 | $145 | $165 | $179 |
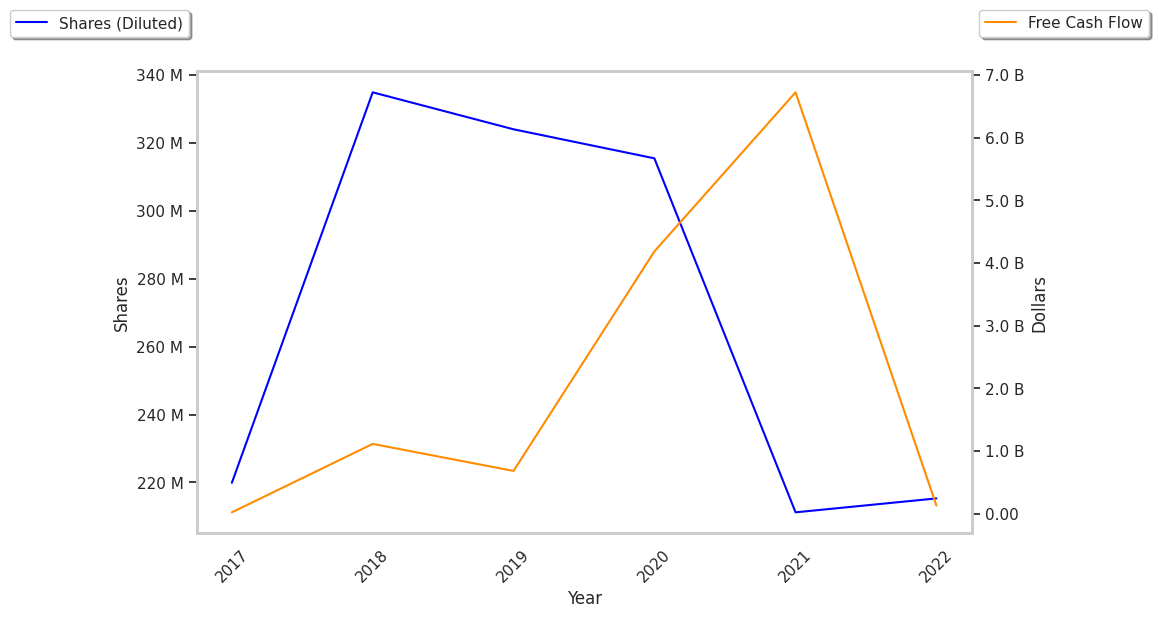
| Diluted Shares (M) | 212 | 210 | 212 | 220 | 214 | 209 |
| Earnings Per Share | $4.87 | $3.9 | $6.61 | $6.85 | $8.13 | $9.89 |
| EPS Growth | n/a | -19.92% | 69.49% | 3.63% | 18.69% | 21.65% |
| Avg. Price | $52.14 | $49.39 | $85.06 | $99.39 | $111.5 | $162.44 |
| P/E Ratio | 10.49 | 12.41 | 12.49 | 14.16 | 13.37 | 16.02 |
| Free Cash Flow (M) | $439 | $3,949 | $6,573 | -$19 | -$3,687 | $1,950 |
| CAPEX (M) | $138 | $124 | $74 | $91 | $173 | $205 |