Now trading at a price of $80.44, Brown & Brown has moved -2.4% so far today.
Brown & Brown returned losses of -22.2% last year, with its stock price reaching a high of $125.68 and a low of $79.85. Over the same period, the stock underperformed the S&P 500 index by -40.7%. AThe company's 50-day average price was $93.13. Brown & Brown, Inc. markets and sells insurance products and services in the United States, Canada, Ireland, the United Kingdom, and internationally. Based in Daytona Beach, FL, the Large-Cap Finance company has 23,000 full time employees. Brown & Brown has offered a 0.2% dividend yield over the last 12 months.
Strong Revenue Growth but an Average Current Ratio:
| 2019 | 2020 | 2021 | 2022 | 2023 | 2024 | |
|---|---|---|---|---|---|---|
| Revenue (M) | $2,392 | $2,613 | $3,051 | $3,573 | $4,257 | $4,805 |
| Interest Income (M) | $64 | $59 | $65 | $141 | $190 | $195 |
| Operating Margins | 22% | 24% | 25% | 25% | 27% | 27% |
| Net Margins | 17% | 18% | 19% | 19% | 20% | 21% |
| Net Income (M) | $399 | $480 | $587 | $672 | $871 | $993 |
| Depreciation & Amort. (M) | $23 | $26 | $33 | $39 | $40 | $44 |
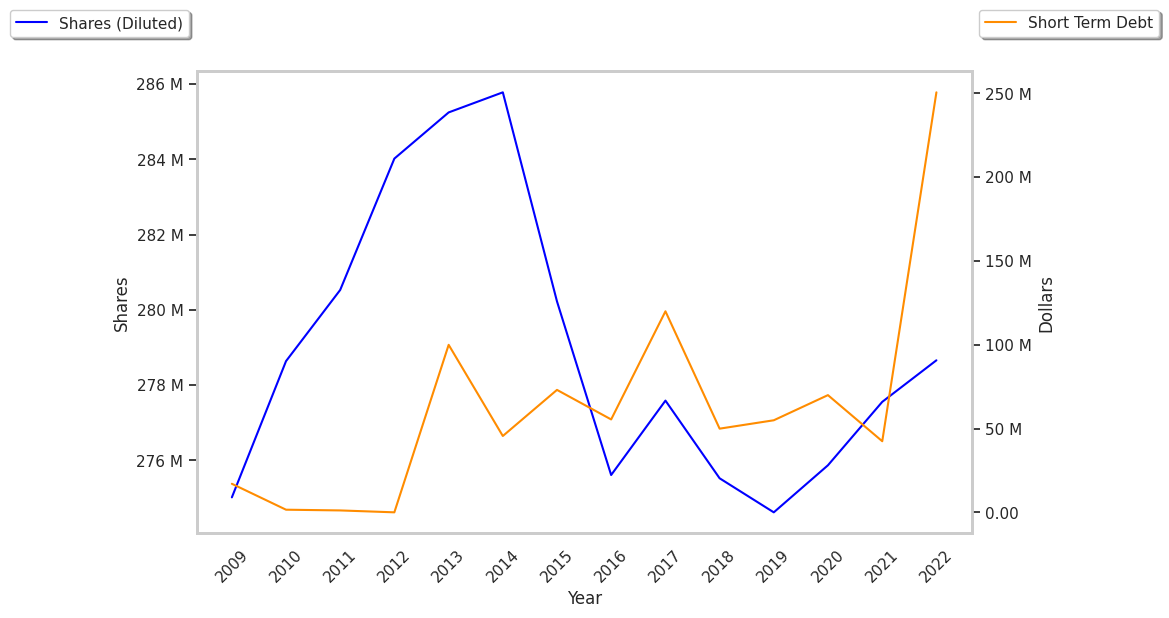
| Diluted Shares (M) | 275 | 276 | 277 | 279 | 281 | 284 |
| Earnings Per Share | $1.45 | $1.74 | $2.12 | $2.41 | $3.1 | $3.5 |
| EPS Growth | n/a | 20.0% | 21.84% | 13.68% | 28.63% | 12.9% |
| Avg. Price | $32.48 | $41.99 | $53.78 | $63.5 | $71.11 | $82.38 |
| P/E Ratio | 22.87 | 24.56 | 25.86 | 26.68 | 23.24 | 23.74 |
| Free Cash Flow (M) | $605 | $642 | $764 | $829 | $941 | $1,092 |
| CAPEX (M) | $73 | $71 | $45 | $52 | $69 | $82 |
| EV / EBITDA | 18.48 | 20.5 | 20.78 | 23.46 | 20.14 | 19.98 |
| Total Debt (M) | $1,610 | $2,166 | $2,065 | $4,193 | $4,365 | $4,049 |
| Net Debt / EBITDA | 1.94 | 2.32 | 1.72 | 3.87 | 3.09 | 2.5 |
| Current Ratio | 1.22 | 1.26 | 1.25 | 1.09 | 1.04 | 1.1 |
Brown & Brown benefits from rapidly growing revenues and a flat capital expenditure trend, strong operating margins with a stable trend, and generally positive cash flows. The company's financial statements show a strong EPS growth trend and reasonable leverage levels. Furthermore, Brown & Brown has just enough current assets to cover current liabilities, as shown by its current ratio of 1.1.
Brown & Brown's Valuation Is in Line With Its Sector Averages:
Brown & Brown has a trailing twelve month P/E ratio of 28.2, compared to an average of 15.92 for the Finance sector. Based on its EPS guidance of $4.09, the company has a forward P/E ratio of 22.8. Brown & Brown's PEG ratio is 2.33 on the basis of the 12.1% weighted average of the company and the broader market's EPS compound average growth rates. This suggests that the company's shares are overvalued. Furthermore, Brown & Brown is likely overvalued compared to the book value of its equity, since its P/B ratio of 2.19 is higher than the sector average of 1.78. The company's shares are currently trading 90.4% below their Graham number. In conclusion, Brown & Brown's impressive cash flow trend, decent P/B ratio, and reasonable use of leverage demonstrate that the company may still be fairly valued — despite its elevated earnings multiple.
Brown & Brown Has an Average Rating of Buy:
The 12 analysts following Brown & Brown have set target prices ranging from $92.0 to $135.0 per share, for an average of $107.5 with a buy rating. The company is trading -25.2% away from its average target price, indicating that there is an analyst consensus of strong upside potential.
Brown & Brown has an average amount of shares sold short because 3.5% of the company's shares are sold short. Institutions own 81.2% of the company's shares, and the insider ownership rate stands at 13.21%, suggesting a large amount of insider shareholders. The largest shareholder is Vanguard Group Inc, whose 11% stake in the company is worth $2,865,700,988.