Now trading at a price of $11.27, Stellantis has moved -0.4% so far today.
Stellantis returned losses of -14.5% last year, with its stock price reaching a high of $14.28 and a low of $8.39. Over the same period, the stock underperformed the S&P 500 index by -33.0%. AThe company's 50-day average price was $9.93. Stellantis N.V. engages in the design, engineering, manufacturing, distribution, and sale of automobiles and light commercial vehicles, engines, transmission systems, metallurgical products, mobility services, and production systems worldwide. Based in Hoofddorp, Netherlands, the Large-Cap Industrials company has 248,243 full time employees. Stellantis has offered a 6.0% dividend yield over the last 12 months.
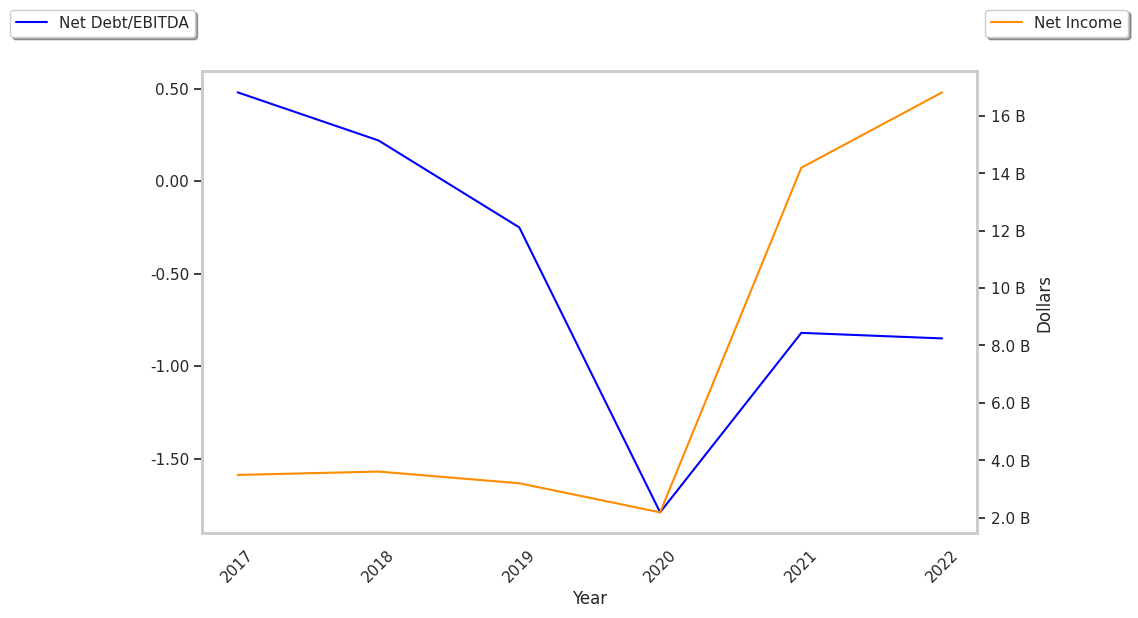
A Flat EPS Growth Trend and Positive Cash Flows:
| 2019 | 2020 | 2021 | 2022 | 2023 | 2024 | |
|---|---|---|---|---|---|---|
| Revenue (M) | $58,993 | $47,656 | $149,419 | $179,592 | $189,544 | $156,878 |
| Operating Margins | 6% | 6% | 11% | 11% | 12% | 2% |
| Net Margins | 6% | 4% | 10% | 9% | 10% | 4% |
| Net Income (M) | $3,584 | $2,023 | $14,208 | $16,779 | $18,625 | $5,520 |
| Net Interest Expense (M) | $140 | $178 | $545 | $959 | $1,064 | $1,248 |
| Diluted Shares (M) | 1,568 | 1,575 | 3,133 | 3,133 | 3,023 | 2,880 |
| Earnings Per Share | $1.95 | $1.34 | $4.51 | $5.31 | $5.94 | $1.84 |
| EPS Growth | n/a | -31.28% | 236.57% | 17.74% | 11.86% | -69.02% |
| Avg. Price | $9.06 | $8.22 | $15.76 | $14.07 | $23.32 | $11.31 |
| P/E Ratio | 4.42 | 5.83 | 3.4 | 2.63 | 3.9 | 6.08 |
| Free Cash Flow (M) | $8,667 | $12,273 | $18,646 | $19,959 | $22,485 | $4,008 |
| Total Debt (M) | $8,025 | $11,068 | $22,624 | $19,469 | $20,001 | $25,028 |
| Current Ratio | 0.81 | 1.19 | 1.15 | 1.27 | 1.24 | 1.09 |
Stellantis does not have a meaningful trailing P/E ratio since its earnings per share are currently in the red. Based on its EPS guidance of $2.98, the company has a forward P/E ratio of 3.3. In comparison, the average P/E ratio for the Industrials sector is 24.03. On the other hand, the market is undervaluing Stellantis in terms of its equity because its P/B ratio is 0.45. In comparison, the sector average is 2.89.
Stellantis Has an Analyst Consensus of Little Upside Potential:
The 8 analysts following Stellantis have set target prices ranging from $8.5 to $15.0 per share, for an average of $11.13 with a buy rating. The company is trading 1.3% away from its average target price, indicating that there is an analyst consensus of little upside potential.
Stellantis has a very low short interest because 1.7% of the company's shares are sold short. Institutions own 49.4% of the company's shares, and the insider ownership rate stands at 23.75%, suggesting a large amount of insider shareholders. The largest shareholder is Bpifrance SA, whose 6% stake in the company is worth $2,170,809,578.