3M logged a -0.4% change during today's morning session, and is now trading at a price of $166.98 per share.
3M returned gains of 28.7% last year, with its stock price reaching a high of $172.85 and a low of $121.98. Over the same period, the stock outperformed the S&P 500 index by 14.5%. More recently, the company's 50-day average price was $159.29. 3M Company provides diversified technology services in the Americas, the Asia Pacific, Europe, the Middle East, Africa, and internationally. Based in Saint Paul, MN, the Large-Cap Health Care company has 61,500 full time employees. 3M has offered a 1.7% dividend yield over the last 12 months.
The Company's Revenues Are Declining:
| 2019 | 2020 | 2021 | 2022 | 2023 | 2024 | |
|---|---|---|---|---|---|---|
| Revenue (M) | $32,136 | $32,184 | $35,355 | $26,161 | $24,610 | $24,575 |
| Operating Margins | 19% | 22% | 21% | 17% | -43% | 20% |
| Net Margins | 14% | 17% | 17% | 22% | -28% | 17% |
| Net Income (M) | $4,517 | $5,449 | $5,921 | $5,777 | -$6,995 | $4,173 |
| Net Interest Expense (M) | $448 | $529 | $488 | $462 | $942 | $472 |
| Depreciation & Amort. (M) | $1,593 | $1,911 | $1,915 | $1,831 | $1,987 | $1,363 |
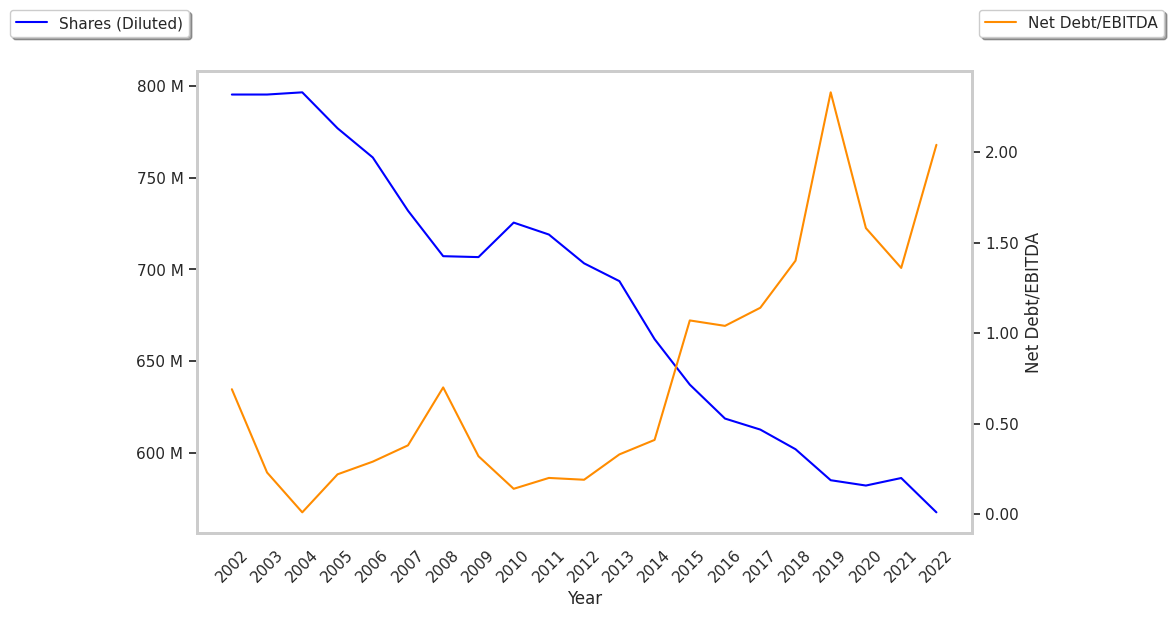
| Diluted Shares (M) | 585 | 582 | 585 | 568 | 554 | 552 |
| Earnings Per Share | $7.72 | $9.36 | $10.12 | $10.18 | -$12.63 | $7.55 |
| EPS Growth | n/a | 21.24% | 8.12% | 0.59% | -224.07% | 159.78% |
| Avg. Price | $153.7 | $141.75 | $172.25 | $142.06 | $109.32 | $167.58 |
| P/E Ratio | 19.63 | 15.03 | 16.84 | 13.91 | -8.66 | 22.11 |
| Free Cash Flow (M) | $5,371 | $6,612 | $5,851 | $3,842 | $5,065 | $638 |
| CAPEX (M) | $1,699 | $1,501 | $1,603 | $1,749 | $1,615 | $1,181 |
| EV / EBITDA | 13.25 | 10.64 | 12.26 | 15.38 | -8.23 | 16.49 |
| Total Debt (M) | $22,154 | $19,589 | $18,654 | $17,877 | $17,187 | $14,963 |
| Net Debt / EBITDA | 1.86 | 1.65 | 1.52 | 2.29 | -1.32 | 1.51 |
| Current Ratio | 1.41 | 1.89 | 1.7 | 1.54 | 1.07 | 1.41 |
an Increase in Expected Earnings Improves Value but Trading Above Its Fair Price:
3M has a trailing twelve month P/E ratio of 25.4, compared to an average of 22.94 for the Health Care sector. Based on its EPS guidance of $7.9, the company has a forward P/E ratio of 20.2. The 0.3% compound average growth rate of 3M's historical and projected earnings per share yields a PEG ratio of 77.03. This suggests that these shares are overvalued. Furthermore, 3M is likely overvalued compared to the book value of its equity, since its P/B ratio of 19.17 is higher than the sector average of 3.19. The company's shares are currently trading 385.8% below their Graham number. Ultimately, 3M's strong cash flows, decent earnings multiple, and healthy debt levels factor towards it being fairly valued, its elevated P/B ratio notwithstanding.
Analysts Give 3M an Average Rating of Buy:
The 16 analysts following 3M have set target prices ranging from $110.0 to $212.0 per share, for an average of $174.94 with a buy rating. The company is trading -4.6% away from its average target price, indicating that there is an analyst consensus of some upside potential.
3M has a very low short interest because 1.3% of the company's shares are sold short. Institutions own 74.4% of the company's shares, and the insider ownership rate stands at 0.1%, suggesting a small amount of insider investors. The largest shareholder is Vanguard Group Inc, whose 9% stake in the company is worth $8,095,423,630.