Now trading at a price of $122.0, Prologis has moved -1.5% so far today.
Prologis returned gains of 8.1% last year, with its stock price reaching a high of $127.5 and a low of $85.35. Over the same period, the stock underperformed the S&P 500 index by -3.7%. The company's 50-day average price was $119.55. Prologis, Inc., is the global leader in logistics real estate with a focus on high-barrier, high-growth markets. Based in San Francisco, CA, the Large-Cap Real Estate company has 2,703 full time employees. Prologis has offered a 3.2% dividend yield over the last 12 months.
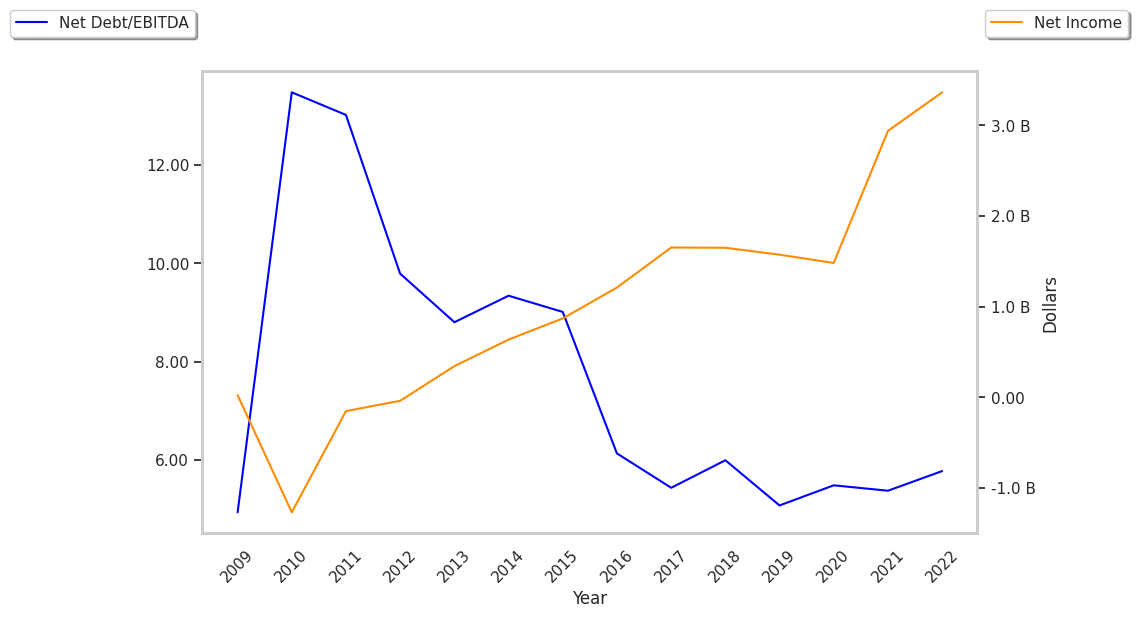
Exceptional Profitability Overshadowed by Excessive Leverage:
| 2019 | 2020 | 2021 | 2022 | 2023 | 2024 | |
|---|---|---|---|---|---|---|
| Revenue (M) | $3,331 | $4,439 | $4,759 | $5,974 | $8,023 | $8,202 |
| Operating Margins | 56% | 48% | 67% | 57% | 46% | 54% |
| Net Margins | 47% | 33% | 62% | 56% | 38% | 45% |
| Net Income (M) | $1,573 | $1,482 | $2,940 | $3,365 | $3,059 | $3,732 |
| Net Interest Expense (M) | $240 | $315 | $266 | $309 | $641 | $864 |
| Depreciation & Amort. (M) | $1,140 | $1,562 | $1,578 | $1,813 | $2,485 | $2,581 |
| Diluted Shares (M) | 655 | 754 | 765 | 812 | 952 | 954 |
| Earnings Per Share | $2.46 | $2.01 | $3.94 | $4.25 | $3.29 | $4.01 |
| EPS Growth | n/a | -18.29% | 96.02% | 7.87% | -22.59% | 21.88% |
| Avg. Price | $71.65 | $87.89 | $118.74 | $139.37 | $133.3 | $121.69 |
| P/E Ratio | 28.89 | 43.51 | 29.91 | 32.56 | 40.39 | 30.27 |
| Free Cash Flow (M) | $469 | $1,017 | $356 | $1,008 | $1,974 | $1,706 |
| CAPEX (M) | $1,795 | $1,920 | $2,640 | $3,118 | $3,399 | $3,206 |
| EV / EBITDA | 18.73 | 22.05 | 18.28 | 24.0 | 24.47 | 20.31 |
| Total Debt (M) | $11,906 | $16,849 | $215 | $23,876 | $29,001 | $30,879 |
| Net Debt / EBITDA | 3.62 | 4.41 | -0.07 | 4.47 | 4.6 | 4.23 |
Prologis has rapidly growing revenues and increasing reinvestment in the business and strong operating margins with a stable trend. Additionally, the company's financial statements display generally positive cash flows and positive EPS growth. However, the firm has a highly leveraged balance sheet.
Prologis's Valuation Is in Line With Its Sector Averages:
Prologis has a trailing twelve month P/E ratio of 34.8, compared to an average of 27.31 for the Real Estate sector. Based on its EPS guidance of $3.52, the company has a forward P/E ratio of 34.0. The 5.3% compound average growth rate of Prologis's historical and projected earnings per share yields a PEG ratio of 6.62. This suggests that these shares are overvalued. Furthermore, Prologis is likely overvalued compared to the book value of its equity, since its P/B ratio of 2.16 is higher than the sector average of 1.94. The company's shares are currently trading 70.7% below their Graham number. In conclusion, Prologis's impressive cash flow trend, decent P/B ratio, and reasonable use of leverage demonstrate that the company may still be fairly valued — despite its elevated earnings multiple.
There's an Analyst Consensus of Some Upside Potential for Prologis:
The 20 analysts following Prologis have set target prices ranging from $116.0 to $145.0 per share, for an average of $130.3 with a buy rating. The company is trading -6.4% away from its average target price, indicating that there is an analyst consensus of some upside potential.
Prologis has a very low short interest because 1.4% of the company's shares are sold short. Institutions own 97.2% of the company's shares, and the insider ownership rate stands at 0.28%, suggesting a small amount of insider investors. The largest shareholder is Vanguard Group Inc, whose 13% stake in the company is worth $14,891,915,726.