Now trading at a price of $207.66, T-Mobile US has moved 0.2% so far today.
T-Mobile US returned losses of -15.3% last year, with its stock price reaching a high of $276.49 and a low of $199.41. Over the same period, the stock underperformed the S&P 500 index by -26.7%. AThe company's 50-day average price was $222.77. T-Mobile US, Inc., together with its subsidiaries, provides wireless communications services in the United States, Puerto Rico, and the United States Virgin Islands. Based in Bellevue, WA, the Large-Cap Telecommunications company has 70,000 full time employees. T-Mobile US has offered a 1.8% dividend yield over the last 12 months.
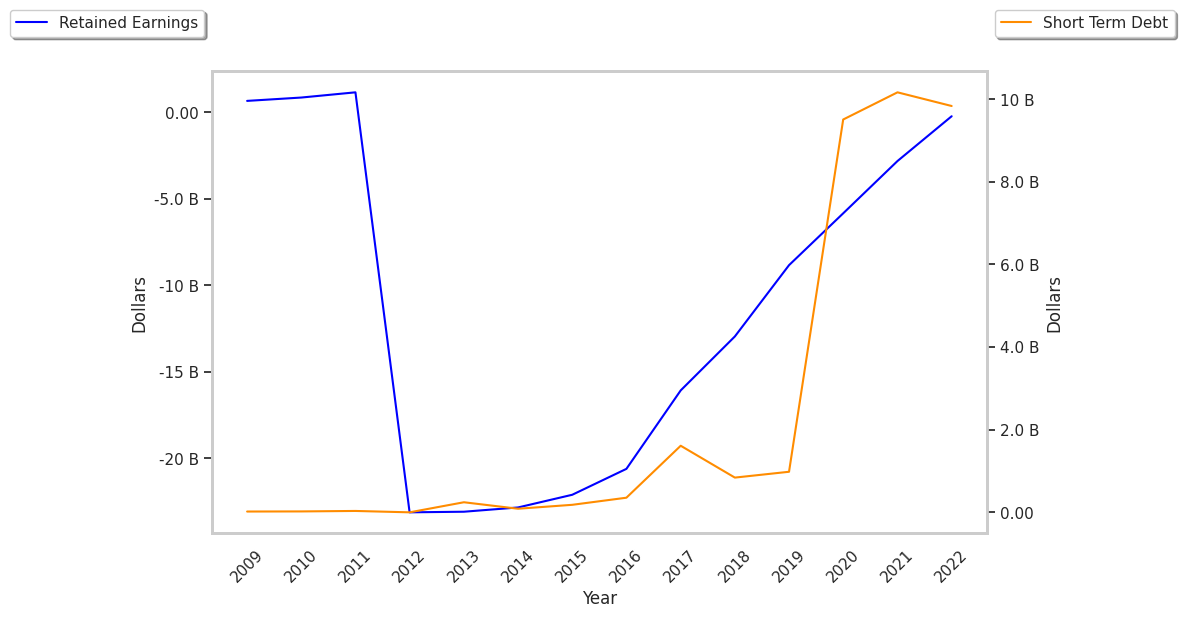
Generally Positive Cash Flows but Not Enough Current Assets to Cover Current Liabilities:
| 2019 | 2020 | 2021 | 2022 | 2023 | 2024 | |
|---|---|---|---|---|---|---|
| Revenue (M) | $44,998 | $68,397 | $80,118 | $79,571 | $78,558 | $81,400 |
| Operating Margins | 13% | 10% | 9% | 8% | 18% | 22% |
| Net Margins | 8% | 4% | 4% | 3% | 11% | 14% |
| Net Income (M) | $3,468 | $3,064 | $3,024 | $2,590 | $8,317 | $11,339 |
| Net Interest Expense (M) | $727 | $2,483 | $3,189 | -$3,364 | -$3,335 | -$3,411 |
| Depreciation & Amort. (M) | $6,616 | $14,151 | $16,383 | $13,651 | $12,818 | $12,100 |
| Diluted Shares (M) | 864 | 1,252 | 1,255 | 1,255 | 1,200 | 1,173 |
| Earnings Per Share | $4.02 | $2.65 | $2.41 | $2.06 | $6.93 | $9.66 |
| EPS Growth | n/a | -34.08% | -9.06% | -14.52% | 236.41% | 39.39% |
| Avg. Price | $75.39 | $103.89 | $130.23 | $125.25 | $160.33 | $207.34 |
| P/E Ratio | 18.57 | 38.76 | 53.81 | 60.51 | 22.84 | 21.38 |
| Free Cash Flow (M) | $433 | -$2,394 | $1,591 | $2,811 | $8,758 | $13,453 |
| CAPEX (M) | $6,391 | $11,034 | $12,326 | $13,970 | $9,801 | $8,840 |
| EV / EBITDA | 7.13 | 7.43 | 9.95 | 11.09 | 9.93 | 10.73 |
| Total Debt (M) | $25,444 | $75,704 | $76,438 | $71,960 | $78,637 | $82,333 |
| Net Debt / EBITDA | 1.94 | 3.14 | 3.0 | 3.34 | 2.71 | 2.55 |
| Current Ratio | 0.74 | 1.1 | 0.89 | 0.77 | 0.91 | 0.91 |
T-Mobile US has strong operating margins with a positive growth rate and generally positive cash flows. Additionally, the company's financial statements display growing revenues and a flat capital expenditure trend and a strong EPS growth trend. However, the firm has not enough current assets to cover current liabilities because its current ratio is 0.91. Finally, we note that T-Mobile US has significant leverage levels.
T-Mobile US's Valuation Is in Line With Its Sector Averages:
T-Mobile US has a trailing twelve month P/E ratio of 21.4, compared to an average of 18.22 for the Telecommunications sector. Based on its EPS guidance of $10.67, the company has a forward P/E ratio of 20.9. According to the 15.0% compound average growth rate of T-Mobile US's historical and projected earnings per share, the company's PEG ratio is 1.43. Taking the weighted average of the company's EPS CAGR and the broader market's 5-year projected EPS growth rate, we obtain a normalized growth rate of 11.7%. On this basis, the company's PEG ratio is 1.84. This suggests that these shares are overvalued. Furthermore, T-Mobile US is likely overvalued compared to the book value of its equity, since its P/B ratio of 3.84 is higher than the sector average of 1.86. The company's shares are currently trading 94.2% below their Graham number.
Analysts Give T-Mobile US an Average Rating of Buy:
The 25 analysts following T-Mobile US have set target prices ranging from $200.0 to $310.0 per share, for an average of $274.0 with a buy rating. The company is trading -24.2% away from its average target price, indicating that there is an analyst consensus of strong upside potential.
T-Mobile US has an average amount of shares sold short because 2.9% of the company's shares are sold short. Institutions own 41.2% of the company's shares, and the insider ownership rate stands at 56.47%, suggesting a large amount of insider shareholders. The largest shareholder is Softbank Group Corporation, whose 4% stake in the company is worth $9,380,985,012.