Hewlett Packard Enterprise Company logged a 0.6% change during today's morning session, and is now trading at a price of $16.89 per share.
Hewlett Packard Enterprise Company returned gains of 21.0% last year, with its stock price reaching a high of $18.14 and a low of $11.9. Over the same period, the stock outperformed the S&P 500 index by 13.0%. More recently, the company's 50-day average price was $17.1. Hewlett Packard Enterprise Company provides solutions that allow customers to capture, analyze, and act upon data seamlessly in the Americas, Europe, the Middle East, Africa, the Asia Pacific, and Japan. Based in Spring, TX, the large-cap Technology company has 60,200 full time employees. Hewlett Packard Enterprise Company has offered a 2.9% dividend yield over the last 12 months.
Wider Gross Margins Than the Industry Average of 23.25%:
| 2017-12-15 | 2018-12-12 | 2019-12-13 | 2020-12-10 | 2021-12-10 | 2022-12-08 | |
|---|---|---|---|---|---|---|
| Revenue (MM) | $28,871 | $30,852 | $29,135 | $26,982 | $27,784 | $28,496 |
| Gross Margins | 30.0% | 30.0% | 33.0% | 31.0% | 34.0% | 33.0% |
| Operating Margins | 7% | 8% | 9% | 6% | 8% | 8% |
| Net Margins | 1.0% | 6.0% | 4.0% | -1.0% | 12.0% | 3.0% |
| Net Income (MM) | $344 | $1,908 | $1,049 | -$322 | $3,427 | $868 |
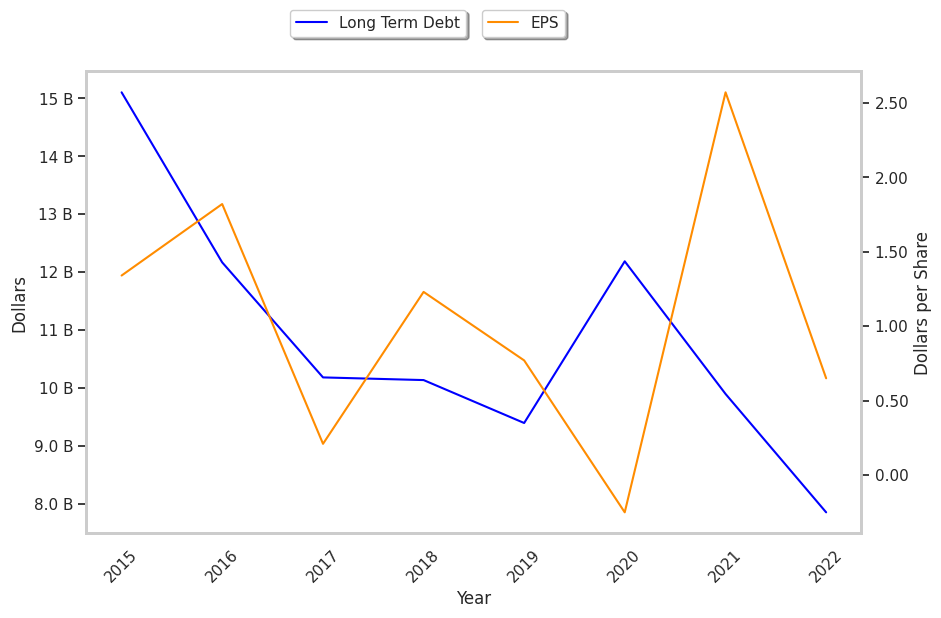
| Earnings Per Share | $0.21 | $1.23 | $0.77 | -$0.25 | $2.57 | $0.65 |
| EPS Growth | n/a | 485.71% | -37.4% | -132.47% | 1128.0% | -74.71% |
| Diluted Shares (MM) | 1,674 | 1,553 | 1,366 | 1,294 | 1,335 | 1,330 |
| Free Cash Flow (MM) | $3,793 | $4,826 | $6,256 | $3,920 | $8,019 | $7,113 |
| Capital Expenditures (MM) | -$2,458 | -$1,862 | -$2,259 | -$1,680 | -$2,148 | -$2,520 |
| Net Current Assets (MM) | -$16,457 | -$16,947 | -$19,511 | -$21,363 | -$18,804 | -$16,708 |
| Long Term Debt (MM) | $10,182 | $10,136 | $9,395 | $12,186 | $9,896 | $7,853 |
| Net Debt / EBITDA | 0.9 | 1.47 | 2.01 | 2.78 | 2.01 | 1.76 |
Hewlett Packard Enterprise Company has strong margins with a stable trend and exceptional EPS growth. Additionally, the company's financial statements display wider gross margins than its peer group and healthy leverage. Furthermore, Hewlett Packard Enterprise Company has weak revenue growth and a flat capital expenditure trend and irregular cash flows.
A Lower P/B Ratio Than Its Sector Average but Trades Above Its Graham Number:
Hewlett Packard Enterprise Company has a trailing twelve month P/E ratio of 21.6, compared to an average of 27.16 for the Technology sector. Based on its EPS guidance of $2.14, the company has a forward P/E ratio of 8.0. The company doesn't provide forward earnings guidance, and the compound average growth rate of its last 6 years of reported EPS is 24.7%. On this basis, Hewlett Packard Enterprise Company's PEG ratio is 0.88. Using instead the 10.5% weighted average of Hewlett Packard Enterprise Company's earnings CAGR and the broader market's anticipated 5-year EPS growth rate, the company's PEG ratio is 2.05, which suggests that its shares may be overpriced. In contrast, the market is likely undervaluing Hewlett Packard Enterprise Company in terms of its equity because its P/B ratio is 1.07 while the sector average is 6.23. The company's shares are currently trading 14.2% above their Graham number.
Analysts Give Hewlett Packard Enterprise Company an Average Rating of Hold:
The 18 analysts following Hewlett Packard Enterprise Company have set target prices ranging from $14.0 to $21.0 per share, for an average of $17.48 with a hold rating. As of April 2023, the company is trading -2.2% away from its average target price, indicating that there is an analyst consensus of some upside potential.
Hewlett Packard Enterprise Company has an average amount of shares sold short because 2.9% of the company's shares are sold short. Institutions own 85.0% of the company's shares, and the insider ownership rate stands at 0.4%, suggesting a small amount of insider investors. The largest shareholder is Vanguard Group Inc, whose 12% stake in the company is worth $2,658,899,692.