Carnival logged a -0.1% change during today's morning session, and is now trading at a price of $16.24 per share.
Carnival returned gains of 54.0% last year, with its stock price reaching a high of $19.55 and a low of $6.11. Over the same period, the stock outperformed the S&P 500 index by 47.0%. More recently, the company's 50-day average price was $17.24. Carnival Corporation & plc engages in the provision of leisure travel services. Based in Miami, FL, the large-cap Consumer Discretionary company has 87,000 full time employees. Carnival has not offered a dividend during the last year.
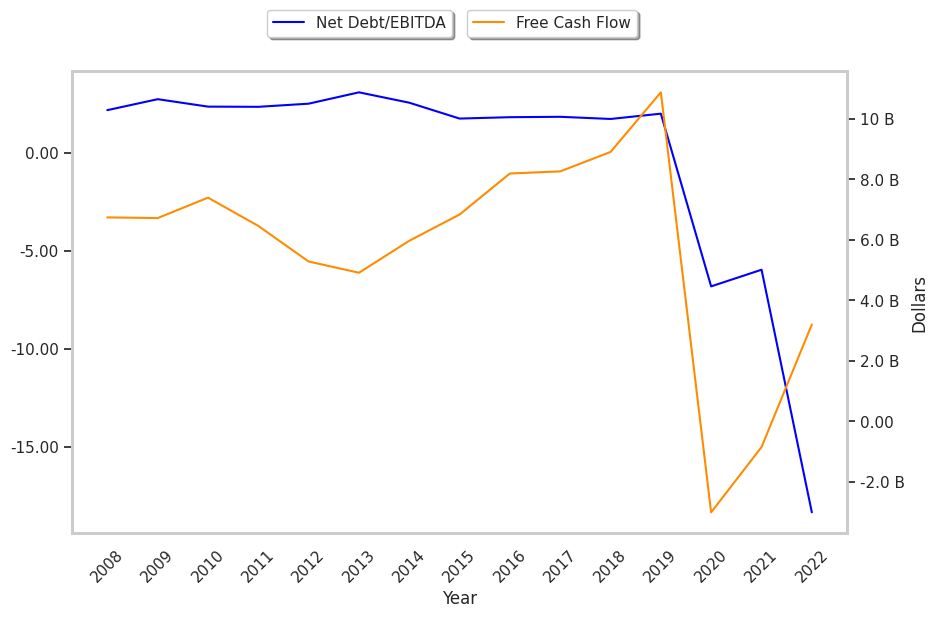
The Business Is Unprofitable and Its Balance Sheet Is Highly Leveraged:
| 2018-01-29 | 2019-01-28 | 2020-03-31 | 2021-01-26 | 2022-01-27 | 2023-01-27 | |
|---|---|---|---|---|---|---|
| Revenue (MM) | $17,510 | $18,880 | $20,825 | $5,594 | $1,908 | $12,169 |
| Gross Margins | 40.0% | 56.0% | 53.0% | -12.0% | -112.0% | 7.0% |
| Operating Margins | 17% | 18% | 16% | -86% | -329% | -32% |
| Net Margins | 15.0% | 17.0% | 14.0% | -183.0% | -498.0% | -50.0% |
| Net Income (MM) | $2,606 | $3,151 | $2,991 | -$10,237 | -$9,501 | -$6,093 |
| Net Interest Expense (MM) | -$189 | -$180 | -$183 | -$877 | -$1,589 | -$1,535 |
| Depreciation & Amort. (MM) | -$1,846 | -$2,017 | -$2,160 | -$2,241 | -$2,233 | -$2,275 |
| Earnings Per Share | $3.59 | $4.44 | $4.32 | -$13.21 | -$8.36 | -$5.34 |
| EPS Growth | n/a | 23.68% | -2.7% | -405.79% | 36.71% | 36.12% |
| Diluted Shares (MM) | 725 | 710 | 692 | 775 | 1,137 | 1,140 |
| Free Cash Flow (MM) | $8,266 | $8,909 | $10,881 | -$3,013 | -$853 | $3,201 |
| Capital Expenditures (MM) | -$2,944 | -$3,360 | -$5,403 | -$3,286 | -$3,256 | -$4,870 |
| Net Current Assets (MM) | -$14,965 | -$15,732 | -$17,632 | -$22,473 | -$31,066 | -$37,146 |
| Long Term Debt (MM) | $6,993 | $7,897 | $9,675 | $22,130 | $28,509 | $31,953 |
Carnival's financial statements include several red flags such as slimmer gross margins than its peers, consistently negative margins with a negative growth trend, and declining EPS growth. Additionally, the firm has high levels of debt. Carnival has weak revenue growth and a flat capital expenditure trend and irregular cash flows.
Carnival does not have a meaningful trailing P/E ratio since its earnings per share are currently in the red. Based on its EPS guidance of $0.95, the company has a forward P/E ratio of 18.1. In comparison, the average P/E ratio for the Consumer Discretionary sector is 22.33. Furthermore, Carnival is likely overvalued compared to the book value of its equity, since its P/B ratio of 3.5 is higher than the sector average of 3.12.
Carnival Has an Average Rating of Buy:
The 14 analysts following Carnival have set target prices ranging from $7.0 to $25.0 per share, for an average of $17.18 with a buy rating. As of April 2023, the company is trading 0.3% away from its average target price, indicating that there is an analyst consensus of some upside potential.
Carnival has an above average percentage of its shares sold short because 11.9% of the company's shares are sold short. Institutions own 52.0% of the company's shares, and the insider ownership rate stands at 8.0%, suggesting a large amount of insider shareholders. The largest shareholder is Vanguard Group Inc, whose 10% stake in the company is worth $1,838,983,453.