DexCom logged a -1.5% change during today's morning session, and is now trading at a price of $102.81 per share.
DexCom returned gains of 16.0% last year, with its stock price reaching a high of $139.55 and a low of $78.94. Over the same period, the stock outperformed the S&P 500 index by 10.0%. More recently, the company's 50-day average price was $124.08. DexCom, Inc., a medical device company, focuses on the design, development, and commercialization of continuous glucose monitoring (CGM) systems in the United States and internationally. Based in San Diego, CA, the large-cap Health Care company has 7,500 full time employees. DexCom has not offered a dividend during the last year.
The Company Has a Positive Net Current Asset Value:
| 2018-02-27 | 2019-02-21 | 2020-02-13 | 2021-02-11 | 2022-02-14 | 2023-02-09 | |
|---|---|---|---|---|---|---|
| Revenue (MM) | $718 | $1,032 | $1,476 | $1,927 | $2,448 | $2,910 |
| Gross Margins | 68.0% | 64.0% | 63.0% | 66.0% | 69.0% | 65.0% |
| Operating Margins | -6% | 3% | 10% | 16% | 14% | 13% |
| Net Margins | -7.0% | -12.0% | 7.0% | 28.0% | 9.0% | 12.0% |
| Net Income (MM) | -$50 | -$127 | $101 | $550 | $217 | $341 |
| Net Interest Expense (MM) | -$10 | -$23 | -$60 | -$18 | -$19 | -$19 |
| Depreciation & Amort. (MM) | -$16 | -$29 | -$49 | -$67 | -$102 | -$156 |
| Earnings Per Share | -$0.15 | -$0.36 | $0.27 | $1.41 | $0.54 | $0.8 |
| EPS Growth | n/a | -140.0% | 175.0% | 422.22% | -61.7% | 48.15% |
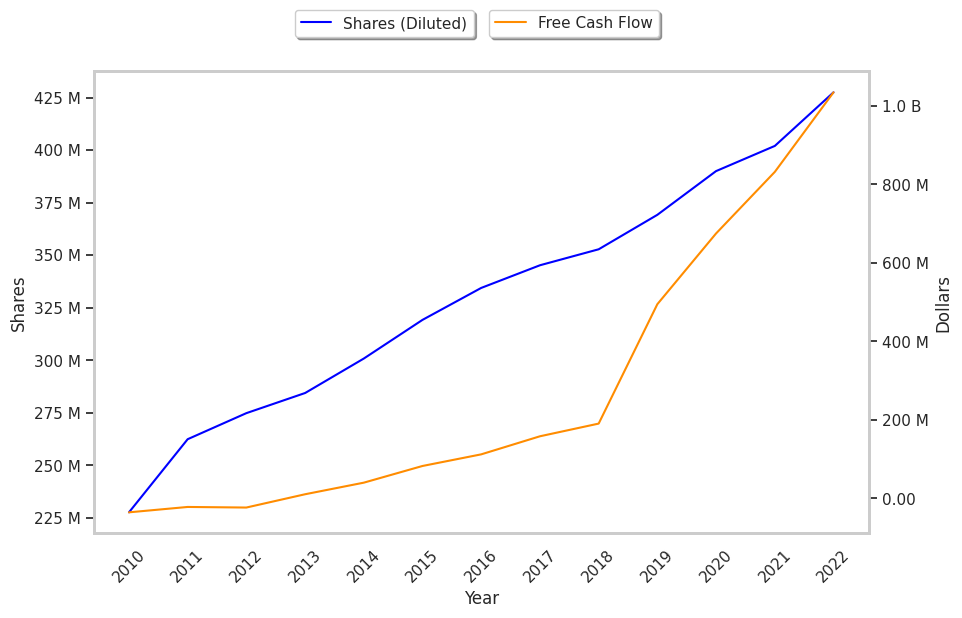
| Diluted Shares (MM) | 345 | 353 | 369 | 390 | 402 | 428 |
| Free Cash Flow (MM) | $158 | $190 | $494 | $675 | $832 | $1,034 |
| Capital Expenditures (MM) | -$66 | -$67 | -$180 | -$199 | -$389 | -$365 |
| Net Current Assets (MM) | $260 | $447 | $457 | $961 | $793 | $409 |
| Long Term Debt (MM) | $328 | $1,010 | $1,060 | $1,667 | $1,982 | $1,198 |
| Net Debt / EBITDA | 8.37 | -6.2 | -2.48 | -2.79 | -1.6 | -0.85 |
DexCom has exceptional EPS growth, a pattern of improving cash flows, and wider gross margins than its peer group. However, the firm has weak operating margins with a positive growth rate. Finally, we note that DexCom has weak revenue growth and a flat capital expenditure trend, a decent current ratio, and significant leverage.
DexCom's P/B and P/E Ratios Are Higher Than Average:
DexCom has a trailing twelve month P/E ratio of 147.7, compared to an average of 24.45 for the Health Care sector. Based on its EPS guidance of $1.61, the company has a forward P/E ratio of 77.1. DexCom's PEG ratio is 13.4 on the basis of the 11.0% weighted average of the company and the broader market's EPS compound average growth rates. This suggests that the company's shares are overvalued. Furthermore, DexCom is likely overvalued compared to the book value of its equity, since its P/B ratio of 18.9 is higher than the sector average of 4.16. The company's shares are currently trading 985.6% above their Graham number.
DexCom Has an Average Rating of Buy:
The 19 analysts following DexCom have set target prices ranging from $130.0 to $175.0 per share, for an average of $149.37 with a buy rating. As of April 2023, the company is trading -16.9% away from its average target price, indicating that there is an analyst consensus of strong upside potential.
DexCom has an average amount of shares sold short because 4.4% of the company's shares are sold short. Institutions own 100.7% of the company's shares, and the insider ownership rate stands at 0.39%, suggesting a small amount of insider investors. The largest shareholder is Vanguard Group Inc, whose 11% stake in the company is worth $4,552,615,708.