OSI Systems logged a 13.3% change during today's morning session, and is now trading at a price of $136.17 per share.
OSI Systems returned gains of 52.0% last year, with its stock price reaching a high of $139.9 and a low of $69.31. Over the same period, the stock outperformed the S&P 500 index by 46.0%. More recently, the company's 50-day average price was $118.92. OSI Systems, Inc. designs and manufactures electronic systems and components worldwide. Based in Hawthorne, CA, the small-cap Technology company has 6,298 full time employees. OSI Systems has not offered a dividend during the last year.
The Company Enjoys Exceptional EPS Growth:
| 2017-09-07 | 2018-08-28 | 2019-08-27 | 2020-08-21 | 2021-08-23 | 2022-08-19 | |
|---|---|---|---|---|---|---|
| Revenue (MM) | $961 | $1,089 | $1,182 | $1,166 | $1,147 | $1,183 |
| Gross Margins | 34.0% | 36.0% | 36.0% | 36.0% | 37.0% | 36.0% |
| Operating Margins | 8% | 8% | 9% | 10% | 11% | 11% |
| Net Margins | 2.0% | -3.0% | 5.0% | 6.0% | 6.0% | 10.0% |
| Net Income (MM) | $21 | -$29 | $65 | $75 | $74 | $115 |
| Net Interest Expense (MM) | -$10 | -$19 | -$22 | -$19 | -$17 | -$9 |
| Depreciation & Amort. (MM) | -$68 | -$70 | -$56 | -$50 | -$44 | -$39 |
| Earnings Per Share | $1.07 | -$1.57 | $3.46 | $4.05 | $4.05 | $6.45 |
| EPS Growth | n/a | -246.73% | 320.38% | 17.05% | 0.0% | 59.26% |
| Diluted Shares (MM) | 20 | 19 | 19 | 19 | 18 | 18 |
| Free Cash Flow (MM) | $85 | $179 | $149 | $150 | $155 | $45 |
| Capital Expenditures (MM) | -$22 | -$46 | -$30 | -$20 | -$16 | $19 |
| Net Current Assets (MM) | -$8 | -$116 | -$72 | -$79 | -$35 | -$59 |
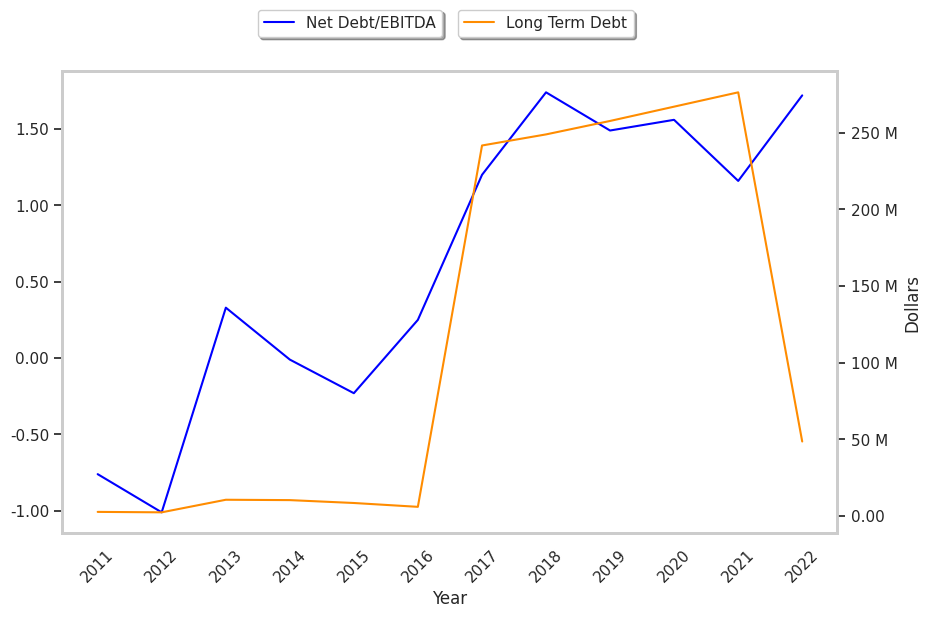
| Long Term Debt (MM) | $242 | $249 | $258 | $267 | $276 | $49 |
| Net Debt / EBITDA | 1.2 | 1.74 | 1.49 | 1.56 | 1.16 | 1.72 |
OSI Systems has weak revenue growth and a flat capital expenditure trend, weak operating margings with a positive growth rate, and irregular cash flows. In addition, we note just enough current assets to cover current liabilities. We also note that the company benefits from exceptional EPS growth and healthy leverage. However, the firm has slimmer gross margins than its peers.
A Lower P/B Ratio Than Its Sector Average but Trades Above Its Graham Number:
OSI Systems has a trailing twelve month P/E ratio of 24.5, compared to an average of 27.16 for the Technology sector. Based on its EPS guidance of $7.13, the company has a forward P/E ratio of 16.7. The company doesn't provide forward earnings guidance, and the compound average growth rate of its last 6 years of reported EPS is 28.6%. On this basis, OSI Systems's PEG ratio is 0.86. Using instead the 10.7% weighted average of OSI Systems's earnings CAGR and the broader market's anticipated 5-year EPS growth rate, the company's PEG ratio is 2.28, which suggests that its shares may be overpriced. In contrast, the market is likely undervaluing OSI Systems in terms of its equity because its P/B ratio is 3.42 while the sector average is 6.23. The company's shares are currently trading 89.1% above their Graham number.
Analysts Give OSI Systems an Average Rating of Buy:
The 4 analysts following OSI Systems have set target prices ranging from $133.0 to $152.0 per share, for an average of $143.0 with a buy rating. As of April 2023, the company is trading -16.8% away from its average target price, indicating that there is an analyst consensus of some upside potential.
OSI Systems has an average amount of shares sold short because 2.8% of the company's shares are sold short. Institutions own 93.6% of the company's shares, and the insider ownership rate stands at 4.86%, suggesting a decent amount of insider shareholders. The largest shareholder is Blackrock Inc., whose 16% stake in the company is worth $356,451,114.