Tenet Healthcare logged a 0.9% change during today's morning session, and is now trading at a price of $75.75 per share.
Tenet Healthcare returned gains of 20.0% last year, with its stock price reaching a high of $85.4 and a low of $36.69. Over the same period, the stock outperformed the S&P 500 index by 13.0%. More recently, the company's 50-day average price was $77.19. Tenet Healthcare Corporation operates as a diversified healthcare services company. Based in Dallas, TX, the mid-cap Health Care company has 75,776 full time employees. Tenet Healthcare has not offered a dividend during the last year.
The Company May Be Profitable, but Its Balance Sheet Is Highly Leveraged:
| 2018-02-26 | 2019-02-25 | 2020-02-24 | 2021-02-19 | 2022-02-18 | 2023-02-21 | |
|---|---|---|---|---|---|---|
| Revenue (MM) | $19,179 | $18,313 | $18,479 | $18,522 | $19,676 | $19,368 |
| Gross Margins | 36.0% | 36.0% | 36.0% | 84.0% | 83.0% | 83.0% |
| Operating Margins | 7% | 9% | 9% | 12% | 12% | 12% |
| Net Margins | -4.0% | 1.0% | -1.0% | 2.0% | 5.0% | 2.0% |
| Net Income (MM) | -$704 | $104 | -$215 | $399 | $916 | $409 |
| Net Interest Expense (MM) | -$1,028 | -$1,004 | -$985 | -$1,003 | -$923 | -$890 |
| Depreciation & Amort. (MM) | -$870 | -$802 | -$850 | -$857 | -$855 | -$841 |
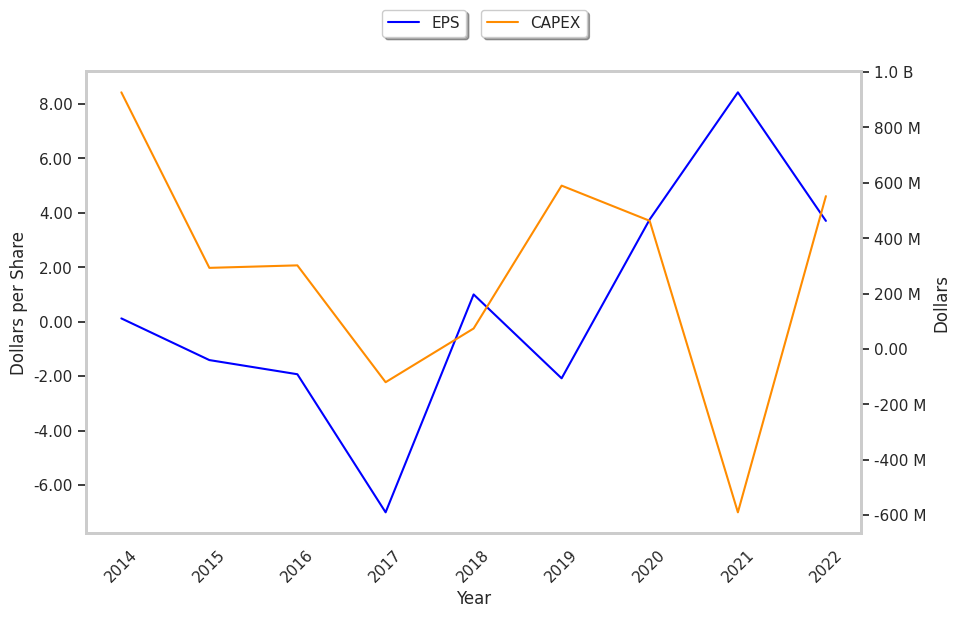
| Earnings Per Share | -$7.0 | $1.0 | -$2.08 | $3.75 | $8.42 | $3.7 |
| EPS Growth | n/a | 114.29% | -308.0% | 280.29% | 124.53% | -56.06% |
| Diluted Shares (MM) | 101 | 104 | 103 | 106 | 109 | 111 |
| Free Cash Flow (MM) | $1,080 | $1,123 | $1,823 | $3,870 | $978 | $1,635 |
| Capital Expenditures (MM) | $120 | -$74 | -$590 | -$463 | $590 | -$552 |
| Net Current Assets (MM) | -$15,407 | -$15,666 | -$16,341 | -$17,070 | -$16,247 | -$16,567 |
| Long Term Debt (MM) | $14,791 | $14,644 | $14,580 | $15,574 | $15,511 | $14,934 |
| Net Debt / EBITDA | 6.34 | 5.98 | 5.68 | 4.43 | 4.07 | 4.37 |
Tenet Healthcare has wider gross margins than its peer group, average operating margins with a positive growth rate, and positive EPS growth. However, the firm has a highly leveraged balance sheet. Finally, we note that Tenet Healthcare has weak revenue growth and a flat capital expenditure trend, irregular cash flows, and just enough current assets to cover current liabilities.
A Lower P/E Ratio Than Its Sector Average but Trades Above Its Graham Number:
Tenet Healthcare has a trailing twelve month P/E ratio of 16.5, compared to an average of 24.45 for the Health Care sector. Based on its EPS guidance of $6.68, the company has a forward P/E ratio of 11.6. The company doesn't issue forward earnings guidance, and the compound average growth rate of its last 6 years of reported EPS is 8.9%. On this basis, the company's PEG ratio is 1.85, which suggests that it is overpriced. Furthermore, Tenet Healthcare is likely overvalued compared to the book value of its equity, since its P/B ratio of 5.73 is higher than the sector average of 4.16. The company's shares are currently trading 28.6% above their Graham number.
Overview of Tenet Healthcare's Market Factors:
Tenet Healthcare has an average amount of shares sold short because 4.2% of the company's shares are sold short. Institutions own 99.4% of the company's shares, and the insider ownership rate stands at 1.79%, suggesting a small amount of insider investors. The largest shareholder is Vanguard Group Inc, whose 11% stake in the company is worth $823,722,922.