Schlumberger logged a -0.2% change during today's afternoon session, and is now trading at a price of $56.65 per share.
Schlumberger returned gains of 46.0% last year, with its stock price reaching a high of $60.12 and a low of $33.8. Over the same period, the stock outperformed the S&P 500 index by 36.0%. More recently, the company's 50-day average price was $54.6. Schlumberger Limited engages in the provision of technology for the energy industry worldwide. The company operates through four divisions: Digital & Integration, Reservoir Performance, Well Construction, and Production Systems. The company provides field development and hydrocarbon production, carbon management, integration of adjacent energy systems; reservoir interpretation and data processing services for exploration data; and well construction and production improvement services and products. Based in Houston, TX, the large-cap Energy company has 99,000 full time employees. Schlumberger has offered a 1.5% dividend yield over the last 12 months.
Wider Gross Margins Than the Industry Average of 11.83%:
| 2018-01-24 | 2019-01-23 | 2020-01-22 | 2021-01-27 | 2022-01-26 | 2023-01-25 | |
|---|---|---|---|---|---|---|
| Revenue (MM) | $30,440 | $32,815 | $32,917 | $23,601 | $22,929 | $28,091 |
| Gross Margins | 13.0% | 13.0% | 13.0% | 11.0% | 16.0% | 18.0% |
| Operating Margins | 10% | 10% | 9% | 8% | 13% | 17% |
| Net Margins | -5.0% | 7.0% | -31.0% | -45.0% | 8.0% | 12.0% |
| Net Income (MM) | -$1,505 | $2,138 | -$10,137 | -$10,518 | $1,881 | $3,441 |
| Net Interest Expense (MM) | -$566 | -$575 | -$609 | -$563 | -$539 | -$490 |
| Depreciation & Amort. (MM) | -$3,837 | -$3,556 | -$3,589 | -$2,566 | -$2,120 | -$2,147 |
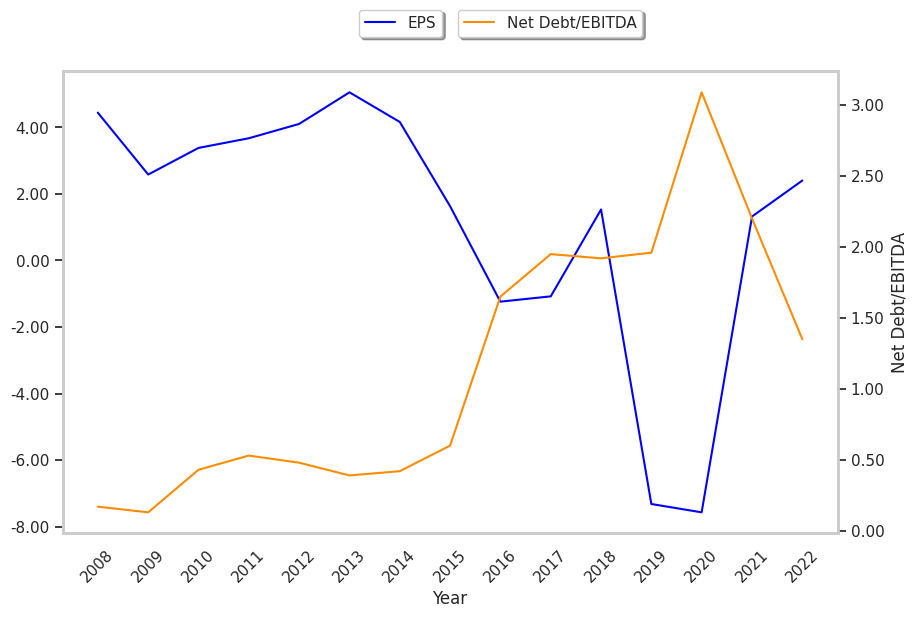
| Earnings Per Share | -$1.08 | $1.53 | -$7.32 | -$7.57 | $1.32 | $2.4 |
| EPS Growth | n/a | 241.67% | -578.43% | -3.42% | 117.44% | 81.82% |
| Diluted Shares (MM) | 1,388 | 1,393 | 1,385 | 1,390 | 1,427 | 1,436 |
| Free Cash Flow (MM) | $7,770 | $7,873 | $7,155 | $4,060 | $5,792 | $4,995 |
| Capital Expenditures (MM) | -$2,107 | -$2,160 | -$1,724 | -$1,116 | -$1,141 | -$1,275 |
| Net Current Assets (MM) | -$16,229 | -$18,190 | -$16,606 | -$17,026 | -$13,571 | -$10,143 |
| Long Term Debt (MM) | $14,875 | $14,644 | $14,770 | $16,036 | $13,286 | $10,594 |
| Net Debt / EBITDA | 1.95 | 1.92 | 1.96 | 3.09 | 2.2 | 1.35 |
Schlumberger has strong margins with a positive growth rate and wider gross margins than its peer group. Additionally, the company's financial statements display a strong EPS growth trend and healthy leverage. Furthermore, Schlumberger has weak revenue growth and a flat capital expenditure trend, irregular cash flows, and just enough current assets to cover current liabilities.
Schlumberger's P/B and P/E Ratios Are Higher Than Average:
Schlumberger has a trailing twelve month P/E ratio of 20.0, compared to an average of 7.54 for the Energy sector. Based on its EPS guidance of $3.66, the company has a forward P/E ratio of 14.9. The company doesn't provide forward earnings guidance, and the compound average growth rate of its last 6 years of reported EPS is 23.4%. On this basis, Schlumberger's PEG ratio is 0.86. Using instead the 10.5% weighted average of Schlumberger's earnings CAGR and the broader market's anticipated 5-year EPS growth rate, the company's PEG ratio is 1.91, which suggests that its shares may be overpriced. Furthermore, Schlumberger is likely overvalued compared to the book value of its equity, since its P/B ratio of 4.33 is higher than the sector average of 1.68. The company's shares are currently trading 117.8% above their Graham number.
Schlumberger Has an Analyst Consensus of Some Upside Potential:
The 28 analysts following Schlumberger have set target prices ranging from $49.0 to $73.0 per share, for an average of $65.5 with a buy rating. As of April 2023, the company is trading -16.6% away from its average target price, indicating that there is an analyst consensus of some upside potential.
Schlumberger has a very low short interest because 1.4% of the company's shares are sold short. Institutions own 83.4% of the company's shares, and the insider ownership rate stands at 0.2%, suggesting a small amount of insider investors. The largest shareholder is Vanguard Group Inc, whose 9% stake in the company is worth $7,314,396,161.