We've been asking ourselves recently if the market has placed a fair valuation on Canadian Pacific Railway. Let's dive into some of the fundamental values of this large-cap Industrials company to determine if there might be an opportunity here for value-minded investors.
A Lower P/B Ratio Than Its Sector Average but Trades Above Its Graham Number:
Canadian Pacific Kansas City Limited, together with its subsidiaries, owns and operates a transcontinental freight railway in Canada and the United States. The company belongs to the Industrials sector, which has an average price to earnings (P/E) ratio of 20.49 and an average price to book (P/B) ratio of 3.78. In contrast, Canadian Pacific Railway has a trailing 12 month P/E ratio of 23.2 and a P/B ratio of 1.83.
Canadian Pacific Railway's PEG ratio is 3.74, which shows that the stock is probably overvalued in terms of its estimated growth. For reference, a PEG ratio near or below 1 is a potential signal that a company is undervalued.
The Company May Be Profitable, but Its Balance Sheet Is Highly Leveraged:
| 2018-04-05 | 2019-01-24 | 2020-04-29 | 2021-02-18 | 2022-02-23 | 2023-02-24 | |
|---|---|---|---|---|---|---|
| Revenue (MM) | $6,554 | $7,316 | $7,792 | $7,710 | $7,995 | $8,814 |
| Gross Margins | 67.0% | 65.0% | 64.0% | 69.0% | 67.0% | 63.0% |
| Operating Margins | 38% | 40% | 40% | 43% | 40% | 38% |
| Net Margins | 37.0% | 27.0% | 31.0% | 32.0% | 36.0% | 40.0% |
| Net Income (MM) | $2,405 | $1,951 | $2,440 | $2,444 | $2,852 | $3,517 |
| Net Interest Expense (MM) | -$473 | -$453 | -$448 | -$458 | -$440 | -$652 |
| Depreciation & Amort. (MM) | -$661 | -$696 | -$706 | -$779 | -$811 | -$853 |
| Earnings Per Share | $3.29 | $2.72 | $3.5 | $3.59 | $4.26 | $3.77 |
| EPS Growth | n/a | -17.33% | 28.68% | 2.57% | 18.66% | -11.5% |
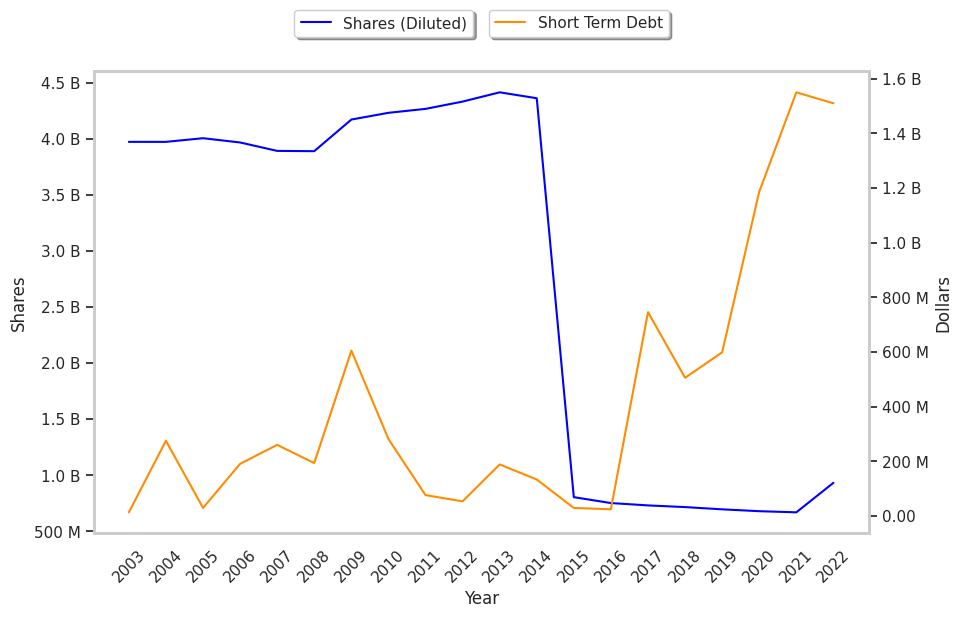
| Diluted Shares (MM) | 732 | 716 | 696 | 680 | 670 | 933 |
| Free Cash Flow (MM) | $3,480 | $4,185 | $4,611 | $4,849 | $17,423 | $5,641 |
| Capital Expenditures (MM) | -$1,298 | -$1,473 | -$1,621 | -$2,047 | -$13,735 | -$1,499 |
| Net Current Assets (MM) | -$12,424 | -$13,501 | -$14,088 | -$15,000 | -$32,996 | -$32,720 |
| Long Term Debt (MM) | $7,413 | $8,190 | $8,158 | $8,585 | $18,577 | $18,141 |
| Net Debt / EBITDA | 2.46 | 2.36 | 2.25 | 2.35 | 4.99 | 4.59 |
Canadian Pacific Railway has wider gross margins than its peer group, average operating margins with a stable trend, and positive EPS growth. However, the firm has a highly leveraged balance sheet. Finally, we note that Canadian Pacific Railway has weak revenue growth and a flat capital expenditure trend and irregular cash flows.