Today we're going to take a closer look at large-cap Real Estate company VICI Properties, whose shares are currently trading at $30.88. We've been asking ourselves whether the company is under or over valued at today's prices... let's perform a brief value analysis to find out!
The Market May Be Undervaluing VICI Properties's Assets and Equity:
VICI Properties Inc. is an S&P 500 experiential real estate investment trust that owns one of the largest portfolios of market-leading gaming, hospitality and entertainment destinations, including Caesars Palace Las Vegas, MGM Grand and the Venetian Resort Las Vegas, three of the most iconic entertainment facilities on the Las Vegas Strip. The company belongs to the Real Estate sector, which has an average price to earnings (P/E) ratio of 24.81 and an average price to book (P/B) ratio of 2.24. In contrast, VICI Properties has a trailing 12 month P/E ratio of 13.8 and a P/B ratio of 1.31.
VICI Properties's PEG ratio is 1.77, which shows that the stock is probably overvalued in terms of its estimated growth. For reference, a PEG ratio near or below 1 is a potential signal that a company is undervalued.
An Exceptionally Strong Balance Sheet:
| 2018-02-01 | 2019-02-14 | 2020-02-20 | 2021-02-18 | 2022-02-23 | 2023-02-23 | |
|---|---|---|---|---|---|---|
| Revenue (MM) | $188 | $898 | $895 | $1,226 | $1,510 | $2,601 |
| Operating Margins | 82% | 86% | 95% | 94% | 94% | 95% |
| Net Margins | 23.0% | 57.0% | 61.0% | 73.0% | 67.0% | 43.0% |
| Net Income (MM) | $43 | $524 | $546 | $892 | $1,014 | $1,118 |
| Net Interest Expense (MM) | -$63 | -$201 | -$228 | -$302 | -$392 | -$530 |
| Depreciation & Amort. (MM) | -$1 | -$4 | -$4 | -$4 | -$3 | -$3 |
| Earnings Per Share | $0.12 | $1.43 | $1.24 | $1.75 | $1.76 | $1.94 |
| EPS Growth | n/a | 1091.67% | -13.29% | 41.13% | 0.57% | 10.23% |
| Diluted Shares (MM) | 356 | 367 | 439 | 511 | 577 | 577 |
| Free Cash Flow (MM) | $129 | $505 | $684 | $836 | $886 | $1,945 |
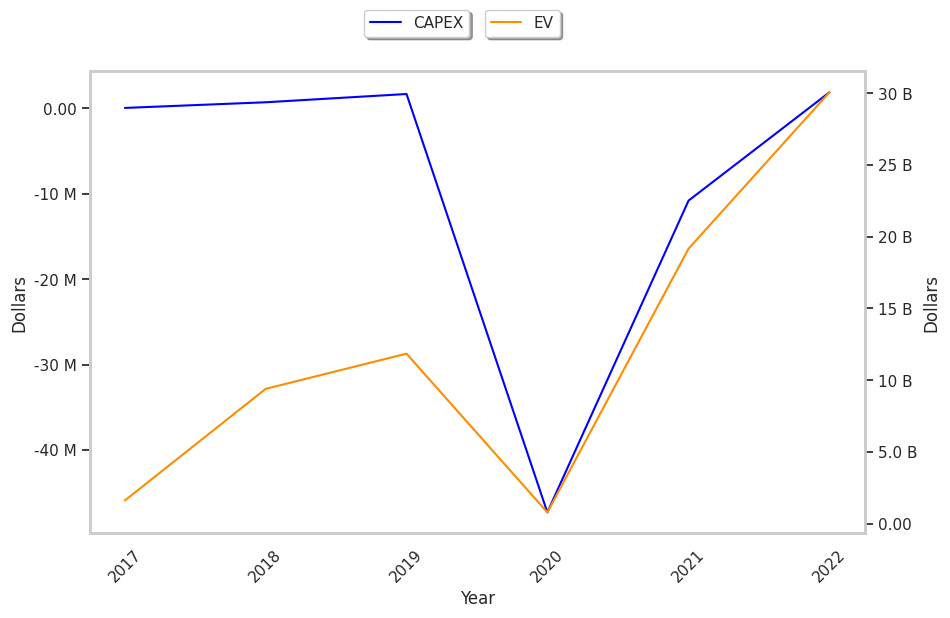
| Capital Expenditures (MM) | -$0 | -$1 | -$2 | $47 | $11 | -$2 |
| Net Current Assets (MM) | n/a | n/a | n/a | n/a | $11,609 | $19,522 |
| Long Term Debt (MM) | n/a | n/a | n/a | n/a | $4,695 | $13,740 |
| LT Debt to Equity | n/a | n/a | n/a | n/a | 0.39 | 0.62 |
VICI Properties benefits from strong margins with a stable trend, exceptional EPS growth, and a pattern of improving cash flows. The company's financial statements show an excellent current ratio and healthy debt levels. Furthermore, VICI Properties has weak revenue growth and a flat capital expenditure trend.