Now trading at a price of $100.5, Crown Castle has moved -0.1% so far today.
Crown Castle returned losses of -39.0% last year, with its stock price reaching a high of $177.78 and a low of $97.94. Over the same period, the stock underperformed the S&P 500 index by -55.0%. As of April 2023, the company's 50-day average price was $108.21. Crown Castle owns, operates and leases more than 40,000 cell towers and approximately 85,000 route miles of fiber supporting small cells and fiber solutions across every major U.S. Based in Houston, TX, the large-cap Real Estate company has 5,000 full time employees. Crown Castle has offered a 6.1% dividend yield over the last 12 months.
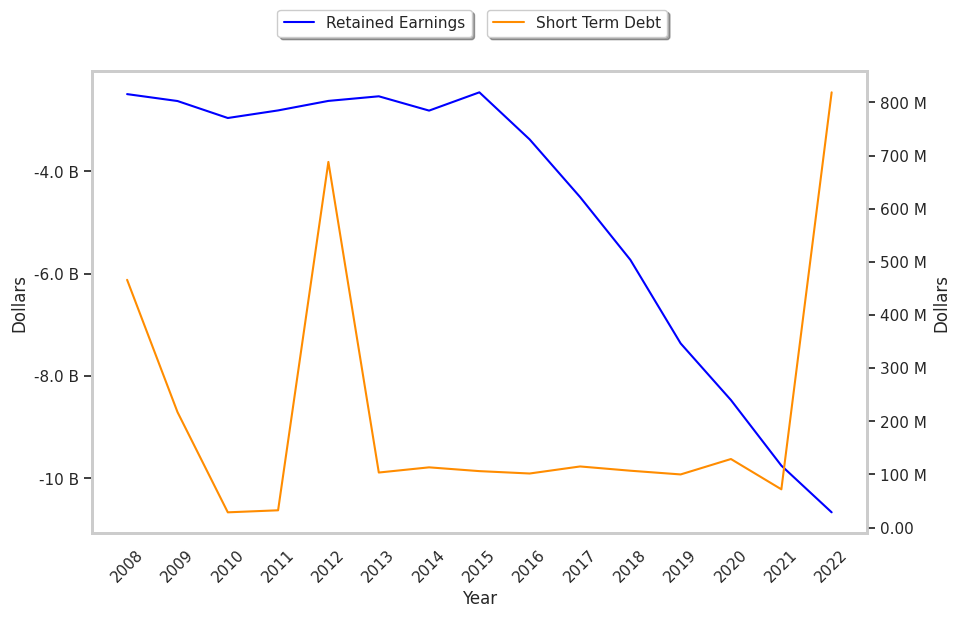
The Company May Be Profitable, but Its Balance Sheet Is Highly Leveraged:
| 2018-02-26 | 2019-02-25 | 2020-03-10 | 2021-02-22 | 2022-02-22 | 2023-02-24 | |
|---|---|---|---|---|---|---|
| Revenue (MM) | $4,356 | $5,370 | $5,763 | $5,840 | $6,340 | $6,986 |
| Operating Margins | 26% | 27% | 28% | 33% | 32% | 35% |
| Net Margins | 10.0% | 12.0% | 15.0% | 18.0% | 20.0% | 24.0% |
| Net Income (MM) | $445 | $622 | $860 | $1,056 | $1,282 | $1,675 |
| Net Interest Expense (MM) | -$572 | -$637 | -$677 | -$687 | -$656 | -$696 |
| Depreciation & Amort. (MM) | -$1,242 | -$1,527 | -$1,572 | -$1,608 | -$1,644 | -$1,707 |
| Earnings Per Share | $1.01 | $1.23 | $1.79 | $2.62 | $2.95 | $3.86 |
| EPS Growth | n/a | 21.78% | 45.53% | 46.37% | 12.6% | 30.85% |
| Diluted Shares (MM) | 383 | 415 | 418 | 425 | 434 | 434 |
| Free Cash Flow (MM) | $3,271 | $4,239 | $4,755 | $4,679 | $4,018 | $4,188 |
| Capital Expenditures (MM) | -$1,228 | -$1,739 | -$2,057 | -$1,624 | -$1,229 | -$1,310 |
| Net Current Assets (MM) | -$18,756 | -$19,522 | -$26,764 | -$28,203 | -$29,528 | -$30,255 |
| Long Term Debt (MM) | $16,044 | $16,575 | $18,021 | $19,151 | $20,557 | $20,910 |
| Net Debt / EBITDA | 6.7 | 5.54 | 5.67 | 5.36 | 5.55 | 5.18 |
Crown Castle's Valuation Is in Line With Its Sector Averages:
Crown Castle has a trailing twelve month P/E ratio of 27.5, compared to an average of 24.81 for the Real Estate sector. Based on its EPS guidance of $3.21, the company has a forward P/E ratio of 33.7. The company doesn't provide forward earnings guidance, and the compound average growth rate of its last 6 years of reported EPS is 25.4%. On this basis, Crown Castle's PEG ratio is 1.08. Using instead the 10.6% weighted average of Crown Castle's earnings CAGR and the broader market's anticipated 5-year EPS growth rate, the company's PEG ratio is 2.6, which suggests that its shares may be overpriced. Furthermore, Crown Castle is likely overvalued compared to the book value of its equity, since its P/B ratio of 6.19 is higher than the sector average of 2.24. The company's shares are currently trading 160.3% above their Graham number.
Crown Castle Has an Average Rating of Hold:
The 17 analysts following Crown Castle have set target prices ranging from $91.0 to $162.0 per share, for an average of $126.35 with a hold rating. As of April 2023, the company is trading -14.4% away from its average target price, indicating that there is an analyst consensus of strong upside potential.
Crown Castle has a very low short interest because 1.4% of the company's shares are sold short. Institutions own 92.6% of the company's shares, and the insider ownership rate stands at 0.35%, suggesting a small amount of insider investors. The largest shareholder is Vanguard Group Inc, whose 13% stake in the company is worth $5,652,155,175.