Discount Store firm Conn's is one of the rare companies that fulfills most of Graham’s requirements for a defensive high-quality stock.
At Market Inference, we adhere to Benjamin Graham’s view that precise forecasting of a company’s prospects is highly uncertain. Investing with a wide margin of safety, determined on the basis of the company’s historical track record, offers far greater chances of positive investment results.
Conn's trades at Attractive Multiples
Benjamin Graham's so-called “Graham number” is a popular metric determining the fair price of a stock in relation to its earnings and the book value of its equity. We calculate the Graham number as √(22.5 * 6 year average earnings per share (1.18) * 6 year average book value per share (19.424), which for Lennar gives us a fair price of $42.08.
In comparison, Conn's’s market price is $4.36 per share. The analysis shouldn’t end here. The Graham number is just one of seven requirements for defensive stocks listed in Chapter 14 of The Intelligent Investor, which we will review below.
Positive Retained Earnings From 2011 To 2023, No Dividend Record, and Eps Growth In Excess Of Graham'S Requirements
Ben Graham wrote that an investment in a company with a record of positive retained earnings could contribute significantly to the margin of safety. Conn's had positive retained earnings from 2011 to 2023 with an average of $421.32 Million over this period.
Another one of Graham's requirements is for a 30% or more cumulative growth rate of the company's earnings per share over the last ten years.To determine Conn's's EPS growth over time, we will average out its EPS for 2010, 2011, and 2012, which were $0.17, $-0.40, and $0.66 respectively. This gives us an average of $0.14 for the period of 2010 to 2012. Next, we compare this value with the average EPS reported in 2021, 2022, and 2023, which were $0.85, $3.61, and $-2.46, for an average of $0.67. Now we see that Conn's's EPS growth was 378.57% during this period, which satisfies Ben Graham's requirement.
We have no record of Conn's offering a regular dividend.
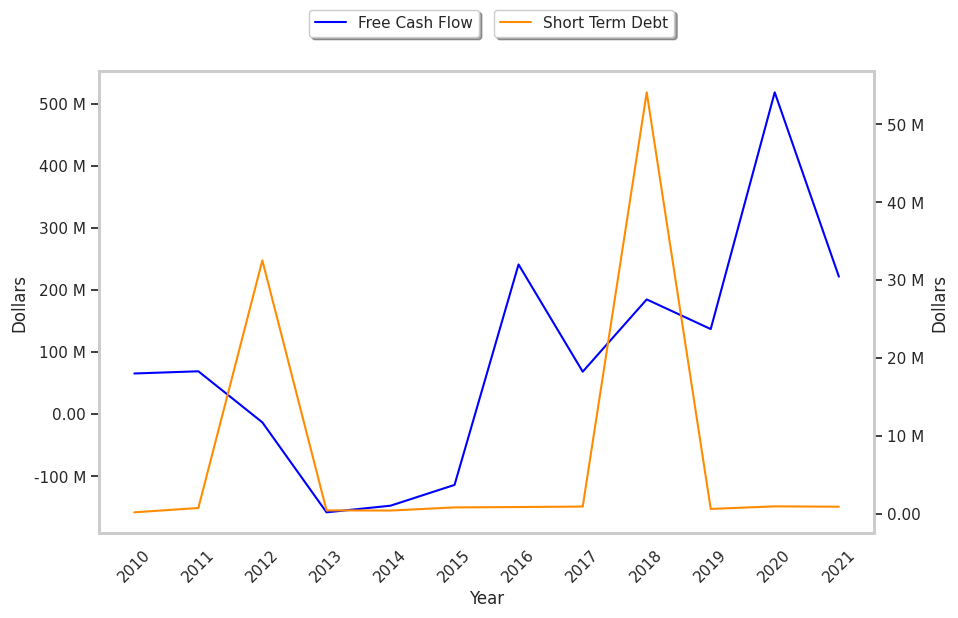
Conn's’s Balance Sheet Meets Graham’s Criteria
It was also essential to Graham that the company’s current assets outweigh its current liabilities, and that its long term debt be inferior to the sum of its net current assets (current assets minus total liabilities). This is the aspect of the analysis that most companies fail, yet Conn's passes comfortably, with an average current ratio of 3.4, and average debt to net current asset ratio of -1.6.
Conclusion
Graham is best known for the Graham number valuation method, and his net-net strategy of investing in a broad portfolio of companies that trade below their net current asset value. But these approaches are too narrow, and fail to capture the full scope of Graham’s statistical approach to stock picking.
Conn's offers a rare combination of value, growth, and profitability. So it comes as no surprise that the company isn’t cheap enough to meet Graham’s definition of a net-net, and that it does not trade, on average, far below its Graham number. Rather, Conn's is an interesting company because it meets Graham’s broader definition of quality.
| 2017-04-04 | 2018-04-05 | 2019-03-26 | 2020-04-14 | 2021-03-31 | 2022-03-29 | |
|---|---|---|---|---|---|---|
| Revenue (MM) | $1,597 | $1,516 | $1,550 | $1,544 | $1,386 | $1,590 |
| Gross Margins | 48.0% | 52.0% | 55.0% | 55.0% | 52.0% | 48.0% |
| Operating Margins | 4% | 8% | 10% | 22% | 17% | 14% |
| Net Margins | -2.0% | 0.0% | 5.0% | 4.0% | 0.0% | 7.0% |
| Net Income (MM) | -$26 | $6 | $74 | $56 | -$3 | $108 |
| Net Interest Expense (MM) | -$99 | -$80 | -$63 | -$59 | -$50 | -$26 |
| Depreciation & Amort. (MM) | -$53 | -$45 | -$32 | -$37 | -$41 | -$45 |
| Earnings Per Share | -$0.83 | $0.2 | $2.28 | $1.82 | -$0.11 | $3.72 |
| EPS Growth | n/a | 124.1% | 1040.0% | -20.18% | -106.04% | 3481.82% |
| Diluted Shares (MM) | 31 | 32 | 32 | 31 | 29 | 29 |
| Free Cash Flow (MM) | $241 | $68 | $185 | $137 | $518 | $221 |
| Capital Expenditures (MM) | -$36 | -$17 | -$33 | -$57 | -$56 | -$45 |
| Net Current Assets (MM) | -$336 | -$286 | -$251 | -$483 | -$354 | -$319 |
| Long Term Debt (MM) | $1,144 | $1,090 | $901 | $1,026 | $609 | $522 |
| Net Debt / EBITDA | 9.59 | 6.75 | 4.92 | 2.71 | 2.19 | 1.96 |