Now trading at a price of $439.2, Charter Communications has moved -0.1% so far today.
Over the last year, Charter Communications logged a 4.0% change, with its stock price reaching a high of $452.25 and a low of $297.66. Over the same period, the stock underperformed the S&P 500 index by -11.0%. As of April 2023, the company's 50-day average price was $395.72. Charter Communications, Inc. operates as a broadband connectivity and cable operator company serving residential and commercial customers in the United States. Based in Stamford, CT, the large-cap Telecommunications company has 101,700 full time employees. Charter Communications has not offered a dividend during the last year.
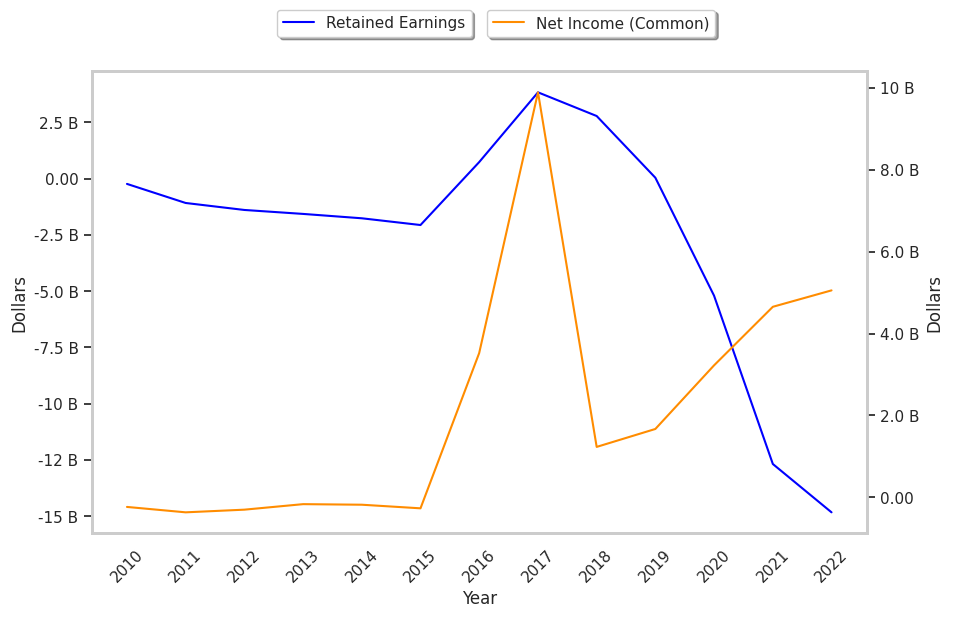
A Pattern of Improving Cash Flows With a Flat Trend:
| 2018-02-02 | 2019-01-31 | 2020-01-31 | 2021-01-29 | 2022-01-28 | 2023-01-27 | |
|---|---|---|---|---|---|---|
| Revenue (MM) | $41,581 | $43,634 | $45,764 | $48,097 | $51,682 | $54,022 |
| Operating Margins | 10% | 12% | 14% | 17% | 20% | 22% |
| Net Margins | 24.0% | 3.0% | 4.0% | 7.0% | 9.0% | 9.0% |
| Net Income (MM) | $9,895 | $1,230 | $1,668 | $3,222 | $4,654 | $5,055 |
| Net Interest Expense (MM) | -$3,090 | -$3,540 | -$3,797 | -$3,848 | -$4,037 | -$4,556 |
| Depreciation & Amort. (MM) | -$10,588 | -$10,318 | -$9,926 | -$9,704 | -$9,345 | -$8,903 |
| Earnings Per Share | $33.35 | $5.22 | $7.45 | $15.4 | $25.8 | $31.47 |
| EPS Growth | n/a | -84.35% | 42.72% | 106.71% | 67.53% | 21.98% |
| Diluted Shares (MM) | 297 | 236 | 224 | 209 | 180 | 161 |
| Free Cash Flow (MM) | $20,635 | $20,892 | $18,943 | $21,977 | $23,874 | $24,301 |
| Capital Expenditures (MM) | -$8,681 | -$9,125 | -$7,195 | -$7,415 | -$7,635 | -$9,376 |
| Net Current Assets (MM) | -$96,537 | -$99,128 | -$102,906 | -$110,016 | -$120,769 | -$127,957 |
| Long Term Debt (MM) | $68,186 | $69,537 | $75,578 | $81,744 | $88,564 | $96,093 |
| Net Debt / EBITDA | 4.74 | 4.65 | 4.6 | 4.51 | 4.58 | 4.65 |
Charter Communications has weak revenue growth and a flat capital expenditure trend, weak operating margings with a positive growth rate, and flat EPS growth. We also note that the company has a pattern of improving cash flows working in its favor. However, the firm has a highly leveraged balance sheet.
A Very Low P/E Ratio but Trades Above Its Graham Number:
Charter Communications has a trailing twelve month P/E ratio of 12.3, compared to an average of 18.85 for the Telecommunications sector. Based on its EPS guidance of $39.15, the company has a forward P/E ratio of 10.1. The company doesn't issue forward earnings guidance, and the compound average growth rate of its last 6 years of reported EPS is -0.6%. On this basis, the company's PEG ratio is -21.26, which indicates that its shares are overpriced. Furthermore, Charter Communications is likely overvalued compared to the book value of its equity, since its P/B ratio of 6.28 is higher than the sector average of 3.12. The company's shares are currently trading 86.7% above their Graham number. Ultimately, Charter Communications's strong cash flows, decent earnings multiple, and healthy debt levels factor towards it being fairly valued, its elevated P/B ratio notwithstanding.
There's an Analyst Consensus of Some Upside Potential for Charter Communications:
The 23 analysts following Charter Communications have set target prices ranging from $291.0 to $665.0 per share, for an average of $479.57 with a hold rating. As of April 2023, the company is trading -17.5% away from its average target price, indicating that there is an analyst consensus of some upside potential.
Charter Communications has an above average percentage of its shares sold short because 8.7% of the company's shares are sold short. Institutions own 69.5% of the company's shares, and the insider ownership rate stands at 33.92%, suggesting a large amount of insider shareholders. The largest shareholder is Dodge & Cox Inc, whose 6% stake in the company is worth $3,762,758,703.