Now trading at a price of $205.58, Norfolk Southern has moved -1.8% so far today.
Norfolk Southern returned losses of -14.0% last year, with its stock price reaching a high of $261.71 and a low of $196.33. Over the same period, the stock underperformed the S&P 500 index by -29.0%. As of April 2023, the company's 50-day average price was $223.63. Norfolk Southern Corporation, together with its subsidiaries, engages in the rail transportation of raw materials, intermediate products, and finished goods in the United States. Based in Atlanta, GA, the large-cap Industrials company has 19,300 full time employees. Norfolk Southern has offered a 2.5% dividend yield over the last 12 months.
Shareholders Are Confronted With a Declining EPS Growth Trend:
| 2018-02-05 | 2019-02-08 | 2020-02-06 | 2021-02-04 | 2022-02-04 | 2023-02-03 | |
|---|---|---|---|---|---|---|
| Revenue (MM) | $10,551 | $11,458 | $11,296 | $9,789 | $11,142 | $12,745 |
| Gross Margins | 43.0% | 44.0% | 45.0% | 46.0% | 51.0% | 47.0% |
| Operating Margins | 33% | 35% | 35% | 35% | 40% | 38% |
| Net Margins | 51.0% | 23.0% | 24.0% | 21.0% | 27.0% | 26.0% |
| Net Income (MM) | $5,404 | $2,666 | $2,722 | $2,013 | $3,005 | $3,270 |
| Net Interest Expense (MM) | -$550 | -$557 | -$604 | -$625 | -$646 | -$692 |
| Depreciation & Amort. (MM) | -$1,059 | -$1,104 | -$1,139 | -$1,154 | -$1,181 | -$1,221 |
| Earnings Per Share | $18.62 | $9.51 | $10.25 | $7.84 | $12.2 | $13.18 |
| EPS Growth | n/a | -48.93% | 7.78% | -23.51% | 55.61% | 8.03% |
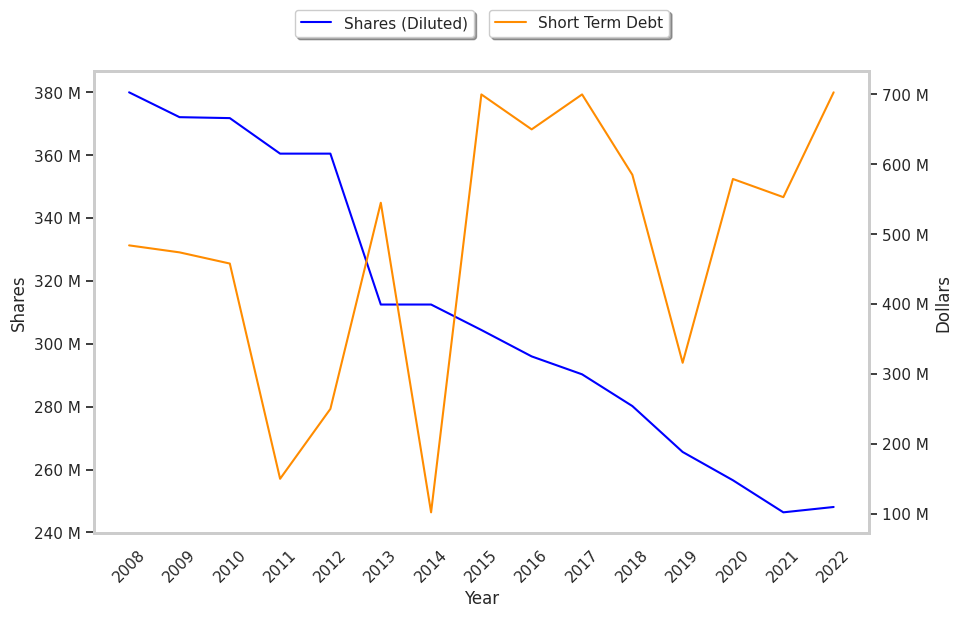
| Diluted Shares (MM) | 290 | 280 | 266 | 257 | 246 | 248 |
| Free Cash Flow (MM) | $4,774 | $5,473 | $5,911 | $5,131 | $5,725 | $6,170 |
| Capital Expenditures (MM) | -$1,521 | -$1,747 | -$2,019 | -$1,494 | -$1,470 | -$1,948 |
| Net Current Assets (MM) | -$17,203 | -$19,015 | -$20,658 | -$20,853 | -$22,685 | -$24,145 |
| Long Term Debt (MM) | $9,136 | $10,560 | $11,880 | $12,102 | $13,287 | $14,479 |
| Net Debt / EBITDA | 2.0 | 2.13 | 2.27 | 2.55 | 2.31 | 2.44 |
Norfolk Southern has weak revenue growth and a flat capital expenditure trend, irregular cash flows, and significant leverage. We also note that the company has average operating margins with a stable trend working in its favor. However, the firm suffers from slimmer gross margins than its peers and declining EPS growth.
Norfolk Southern's Valuation Is in Line With Its Sector Averages:
Norfolk Southern has a trailing twelve month P/E ratio of 20.1, compared to an average of 20.49 for the Industrials sector. Based on its EPS guidance of $13.72, the company has a forward P/E ratio of 16.3. The company doesn't issue forward earnings guidance, and the compound average growth rate of its last 6 years of reported EPS is -8.2%. On this basis, the company's PEG ratio is -2.44, which indicates that its shares are overpriced. In contrast, the market is likely undervaluing Norfolk Southern in terms of its equity because its P/B ratio is 3.69 while the sector average is 3.78. The company's shares are currently trading 66.6% above their Graham number.
Norfolk Southern Has an Average Rating of Buy:
The 25 analysts following Norfolk Southern have set target prices ranging from $177.0 to $279.0 per share, for an average of $250.36 with a buy rating. As of April 2023, the company is trading -10.7% away from its average target price, indicating that there is an analyst consensus of some upside potential.
Norfolk Southern has a very low short interest because 1.1% of the company's shares are sold short. Institutions own 76.2% of the company's shares, and the insider ownership rate stands at 0.14%, suggesting a small amount of insider investors. The largest shareholder is Vanguard Group Inc, whose 8% stake in the company is worth $3,802,229,681.