Titan Machinery does not have the profile of a defensive investment based on the requirements of Ben Graham. The Retail firm may nonetheless be of interest to more risk-oriented investors who have a solid thesis on the company's future growth. At Market Inference, we remain agnostic as to such further developments, and prefer to use a company's past track record as the bellwether for future potential gains.
Titan Machinery Trades at Fair Multiples
The “Graham number” is an equation that enables us to quickly determine how a stock is valued in terms of its earnings and assets:
√(22.5 * 6 year average earnings per share (0.67) * 6 year average book value per share (25.192) = $35.67
At today's price of $32.06 per share, Titan Machinery is now trading -10.1% below price that Graham would recommend paying for the stock.
Some people use the Graham number alone, but it is best to consider it together with the other requirements for defensive stocks that Graham listed in Chapter 14 of The Intelligent Investor.
Positive Retained Earnings From 2011 To 2023, No Dividend Record, and Eps Growth In Excess Of Graham'S Requirements
Ben Graham wrote that an investment in a company with a record of positive retained earnings could contribute significantly to the margin of safety. Titan Machinery had positive retained earnings from 2011 to 2023 with an average of $129.85 Million over this period.
Another one of Graham's requirements is for a 30% or more cumulative growth rate of the company's earnings per share over the last ten years.To determine Titan Machinery's EPS growth over time, we will average out its EPS for 2010, 2011, and 2012, which were $0.88, $0.61, and $0.66 respectively. This gives us an average of $0.72 for the period of 2010 to 2012. Next, we compare this value with the average EPS reported in 2021, 2022, and 2023, which were $0.86, $2.92, and $4.49, for an average of $2.76. Now we see that Titan Machinery's EPS growth was 283.33% during this period, which satisfies Ben Graham's requirement.
We have no record of Titan Machinery offering a regular dividend.
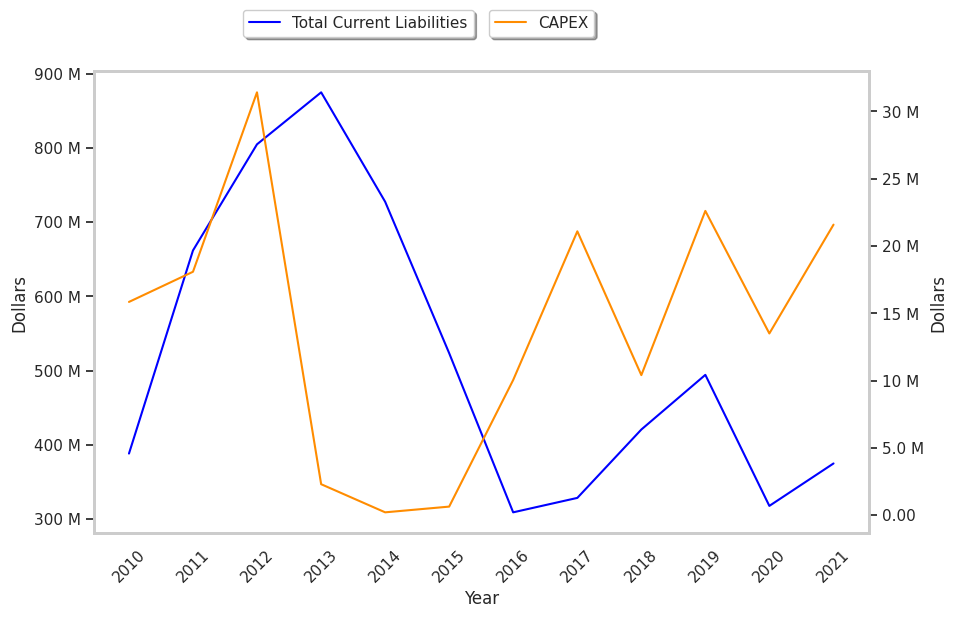
Too Much Debt and a Decent Current Ratio
Graham sought companies with extremely low debt levels compared to their assets. For one, he expected their current ratio to be over 2 and their long term debt to net current asset ratio to be near, or ideally under, under 1. Titan Machinery fails on both counts with a current ratio of 1.8 and a debt to net current asset ratio of 0.4.
Conclusion
According to Graham's analysis, Titan Machinery is likely a company of average quality, which does not offer a significant enough margin of safety for a risk averse investor.
| 2017-04-07 | 2018-04-06 | 2019-04-05 | 2020-04-07 | 2021-03-31 | 2022-04-01 | |
|---|---|---|---|---|---|---|
| Revenue (MM) | $1,213 | $1,203 | $1,262 | $1,305 | $1,411 | $1,712 |
| Gross Margins | 18.0% | 18.0% | 18.0% | 19.0% | 19.0% | 19.0% |
| Operating Margins | 0% | 1% | 2% | 2% | 3% | 5% |
| Net Margins | -1.0% | -1.0% | 1.0% | 1.0% | 1.0% | 4.0% |
| Net Income (MM) | -$14 | -$7 | $12 | $14 | $19 | $66 |
| Net Interest Expense (MM) | -$22 | -$17 | -$14 | -$7 | -$7 | -$3 |
| Depreciation & Amort. (MM) | -$27 | -$25 | -$24 | -$28 | -$24 | -$22 |
| Earnings Per Share | -$0.65 | -$0.32 | $0.56 | $0.64 | $0.88 | $2.93 |
| EPS Growth | n/a | 50.77% | 275.0% | 14.29% | 37.5% | 232.95% |
| Diluted Shares (MM) | 21 | 22 | 22 | 22 | 22 | 23 |
| Free Cash Flow (MM) | $151 | $117 | $57 | $24 | $186 | $180 |
| Capital Expenditures (MM) | -$10 | -$21 | -$10 | -$23 | -$13 | -$22 |
| Net Current Assets (MM) | $158 | $161 | $184 | $97 | $136 | $179 |
| Long Term Debt (MM) | $127 | $97 | $21 | $38 | $45 | $75 |
| Net Debt / EBITDA | 2.97 | 1.2 | 0.17 | 0.38 | -0.28 | -0.58 |