Now trading at a price of $269.05, Biogen has moved 0.6% so far today.
Biogen returned gains of 37.0% last year, with its stock price reaching a high of $319.76 and a low of $194.42. Over the same period, the stock outperformed the S&P 500 index by 20.0%. More recently, the company's 50-day average price was $273.4. Biogen Inc. discovers, develops, manufactures, and delivers therapies for treating neurological and neurodegenerative diseases in the United States, Europe, Germany, Asia, and internationally. Based in Cambridge, MA, the large-cap Health Care company has 8,725 full time employees. Biogen has not offered a dividend during the last year.
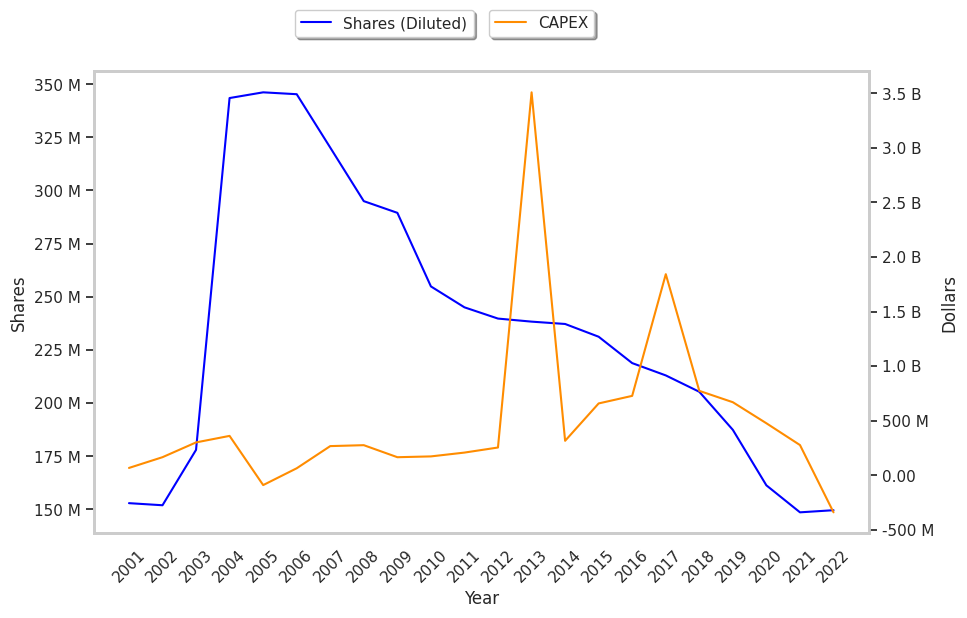
EPS Trend Sustained Primarily by Reducing the Number of Shares Outstanding:
| 2018-02-01 | 2019-02-06 | 2020-02-06 | 2021-02-03 | 2022-02-03 | 2023-02-15 | |
|---|---|---|---|---|---|---|
| Revenue (MM) | $12,274 | $13,453 | $14,378 | $13,445 | $10,982 | $10,173 |
| Gross Margins | 87.0% | 86.0% | 86.0% | 87.0% | 81.0% | 78.0% |
| Operating Margins | 45% | 46% | 54% | 38% | 34% | 32% |
| Net Margins | 21.0% | 33.0% | 41.0% | 30.0% | 14.0% | 30.0% |
| Net Income (MM) | $2,539 | $4,431 | $5,888 | $4,001 | $1,556 | $3,047 |
| Earnings Per Share | $11.92 | $21.58 | $31.42 | $24.8 | $10.47 | $20.37 |
| EPS Growth | n/a | 81.04% | 45.6% | -21.07% | -57.78% | 94.56% |
| Diluted Shares (MM) | 213 | 205 | 187 | 161 | 149 | 150 |
| Free Cash Flow (MM) | $6,394 | $6,961 | $7,748 | $4,707 | $3,917 | $1,045 |
| Capital Expenditures (MM) | -$1,843 | -$774 | -$670 | -$477 | -$277 | $339 |
| Net Current Assets (MM) | -$3,181 | -$4,616 | -$5,513 | -$7,046 | -$5,061 | -$1,374 |
| Long Term Debt (MM) | $5,935 | $5,936 | $4,459 | $7,426 | $6,274 | $6,281 |
Biogen has strong margins with a negative growth trend and an excellent current ratio. Additionally, the company's financial statements display healthy debt levels and wider gross margins than its peer group. However, the firm suffers from EPS growth achieved by reducing the number of outstanding shares and a deteriorating pattern of cash flows. Finally, we note that Biogen has weak revenue growth and a flat capital expenditure trend.
A Lower P/B Ratio Than Its Sector Average but Trades Above Its Graham Number:
Biogen has a trailing twelve month P/E ratio of 14.9, compared to an average of 24.45 for the Health Care sector. Based on its EPS guidance of $17.01, the company has a forward P/E ratio of 16.1. The company doesn't issue forward earnings guidance, and the compound average growth rate of its last 6 years of reported EPS is 7.4%. On this basis, the company's PEG ratio is 2.0, which suggests that it is overpriced. In contrast, the market is likely undervaluing Biogen in terms of its equity because its P/B ratio is 2.69 while the sector average is 4.16. The company's shares are currently trading 32.8% above their Graham number.
Biogen Has an Average Rating of Buy:
The 29 analysts following Biogen have set target prices ranging from $269.0 to $500.0 per share, for an average of $330.86 with a buy rating. As of April 2023, the company is trading -17.4% away from its average target price, indicating that there is an analyst consensus of some upside potential.
Biogen has an average amount of shares sold short because 2.4% of the company's shares are sold short. Institutions own 90.9% of the company's shares, and the insider ownership rate stands at 0.68%, suggesting a small amount of insider investors. The largest shareholder is Primecap Management Company, whose 11% stake in the company is worth $4,311,801,845.