Today we're going to take a closer look at large-cap Real Estate company Crown Castle, whose shares are currently trading at $99.83. We've been asking ourselves whether the company is under or over valued at today's prices... let's perform a brief value analysis to find out!
Crown Castle's Valuation Is in Line With Its Sector Averages:
Crown Castle owns, operates and leases more than 40,000 cell towers and approximately 85,000 route miles of fiber supporting small cells and fiber solutions across every major U.S. The company belongs to the Real Estate sector, which has an average price to earnings (P/E) ratio of 24.81 and an average price to book (P/B) ratio of 2.24. In contrast, Crown Castle has a trailing 12 month P/E ratio of 25.4 and a P/B ratio of 6.15.
When we divide Crown Castle's P/E ratio by its expected EPS growth rate of the next five years, we obtain its PEG ratio of -5.43. Since it's negative, the company has negative growth expectations, and most investors will probably avoid the stock unless it has an exceptionally low P/E and P/B ratio.
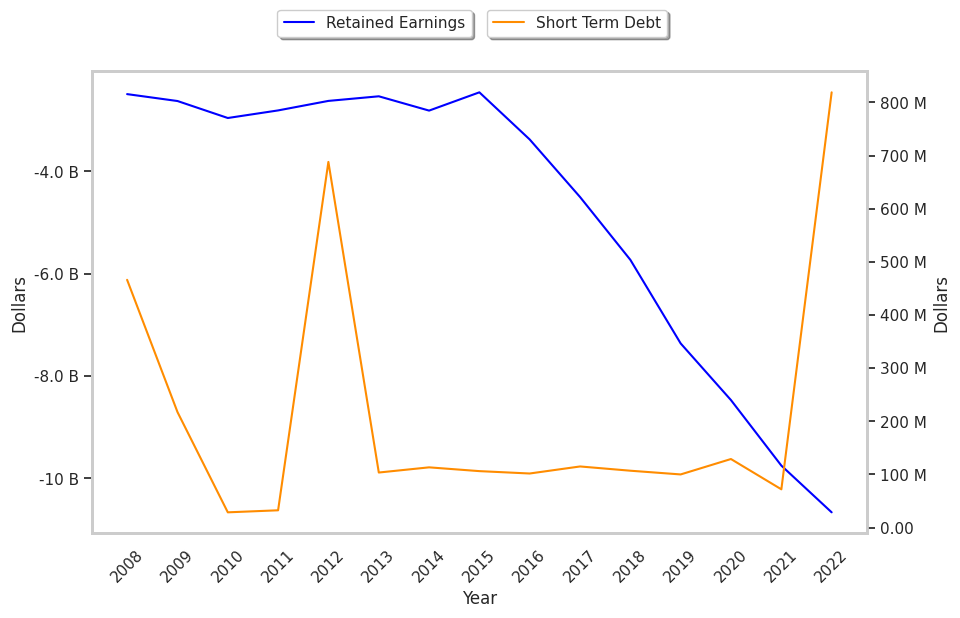
The Company May Be Profitable, but Its Balance Sheet Is Highly Leveraged:
| 2018-02-26 | 2019-02-25 | 2020-03-10 | 2021-02-22 | 2022-02-22 | 2023-02-24 | |
|---|---|---|---|---|---|---|
| Revenue (MM) | $4,356 | $5,370 | $5,763 | $5,840 | $6,340 | $6,986 |
| Operating Margins | 26% | 27% | 28% | 33% | 32% | 35% |
| Net Margins | 10.0% | 12.0% | 15.0% | 18.0% | 20.0% | 24.0% |
| Net Income (MM) | $445 | $622 | $860 | $1,056 | $1,282 | $1,675 |
| Net Interest Expense (MM) | -$572 | -$637 | -$677 | -$687 | -$656 | -$696 |
| Depreciation & Amort. (MM) | -$1,242 | -$1,527 | -$1,572 | -$1,608 | -$1,644 | -$1,707 |
| Earnings Per Share | $1.01 | $1.23 | $1.79 | $2.62 | $2.95 | $3.86 |
| EPS Growth | n/a | 21.78% | 45.53% | 46.37% | 12.6% | 30.85% |
| Diluted Shares (MM) | 383 | 415 | 418 | 425 | 434 | 434 |
| Free Cash Flow (MM) | $3,271 | $4,239 | $4,755 | $4,679 | $4,018 | $4,188 |
| Capital Expenditures (MM) | -$1,228 | -$1,739 | -$2,057 | -$1,624 | -$1,229 | -$1,310 |
| Net Current Assets (MM) | -$18,756 | -$19,522 | -$26,764 | -$28,203 | -$29,528 | -$30,255 |
| Long Term Debt (MM) | $16,044 | $16,575 | $18,021 | $19,151 | $20,557 | $20,910 |
| Net Debt / EBITDA | 6.7 | 5.54 | 5.67 | 5.36 | 5.55 | 5.18 |