We've been asking ourselves recently if the market has placed a fair valuation on American Tower. Let's dive into some of the fundamental values of this large-cap Real Estate company to determine if there might be an opportunity here for value-minded investors.
American Tower Has Elevated P/B and P/E Ratios:
American Tower, one of the largest global REITs, is a leading independent owner, operator and developer of multitenant communications real estate with a portfolio of nearly 226,000 communications sites and a highly interconnected footprint of U. The company belongs to the Real Estate sector, which has an average price to earnings (P/E) ratio of 24.81 and an average price to book (P/B) ratio of 2.24. In contrast, American Tower has a trailing 12 month P/E ratio of 88.6 and a P/B ratio of 16.3.
American Tower's PEG ratio is 4.16, which shows that the stock is probably overvalued in terms of its estimated growth. For reference, a PEG ratio near or below 1 is a potential signal that a company is undervalued.
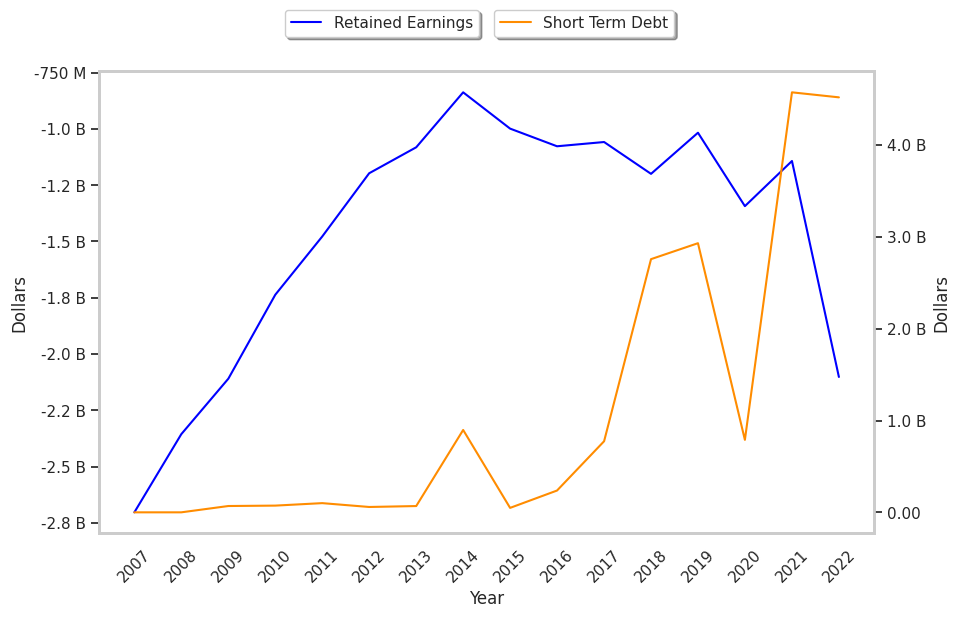
The Company May Be Profitable, but Its Balance Sheet Is Highly Leveraged:
| 2018-02-28 | 2019-02-27 | 2020-02-25 | 2021-02-25 | 2022-02-25 | 2023-02-23 | |
|---|---|---|---|---|---|---|
| Revenue (MM) | $6,664 | $7,440 | $7,580 | $8,042 | $9,357 | $10,711 |
| Operating Margins | 30% | 26% | 35% | 36% | 33% | 22% |
| Net Margins | 19.0% | 17.0% | 25.0% | 21.0% | 27.0% | 16.0% |
| Net Income (MM) | $1,239 | $1,236 | $1,888 | $1,691 | $2,568 | $1,766 |
| Net Interest Expense (MM) | -$703 | -$771 | -$767 | -$754 | -$830 | -$1,065 |
| Depreciation & Amort. (MM) | -$1,716 | -$2,111 | -$1,778 | -$1,882 | -$2,333 | -$3,355 |
| Earnings Per Share | $2.67 | $2.77 | $4.24 | $3.79 | $5.62 | $3.82 |
| EPS Growth | n/a | 3.75% | 53.07% | -10.61% | 48.28% | -32.03% |
| Diluted Shares (MM) | 432 | 443 | 446 | 446 | 457 | 463 |
| Free Cash Flow (MM) | $3,729 | $4,662 | $4,744 | $4,913 | $6,197 | $5,570 |
| Capital Expenditures (MM) | -$804 | -$913 | -$991 | -$1,032 | -$1,377 | -$1,874 |
| Net Current Assets (MM) | -$23,222 | -$23,721 | -$33,661 | -$39,547 | -$57,089 | -$51,164 |
| Long Term Debt (MM) | $19,430 | $18,405 | $21,127 | $28,498 | $38,686 | $34,156 |
| Net Debt / EBITDA | 5.22 | 4.97 | 5.05 | 5.77 | 7.56 | 6.42 |