Today we're going to take a closer look at large-cap Consumer Discretionary company Southwest Airlines Company, whose shares are currently trading at $31.12. We've been asking ourselves whether the company is under or over valued at today's prices... let's perform a brief value analysis to find out!
A Lower P/B Ratio Than Its Sector Average but Trades Above Its Graham Number:
Southwest Airlines Co. operates as a passenger airline company that provide scheduled air transportation services in the United States and near-international markets. The company belongs to the Consumer Discretionary sector, which has an average price to earnings (P/E) ratio of 22.33 and an average price to book (P/B) ratio of 3.12. In contrast, Southwest Airlines Company has a trailing 12 month P/E ratio of 33.1 and a P/B ratio of 1.72.
When we divideSouthwest Airlines Company's P/E ratio by its expected five-year EPS growth rate, we obtain a PEG ratio of 0.35, which indicates that the market is undervaluing the company's projected growth (a PEG ratio of 1 indicates a fairly valued company). Your analysis of the stock shouldn't end here. Rather, a good PEG ratio should alert you that it may be worthwhile to take a closer look at the stock.
Low Leverage Levels but a Declining EPS Growth Trend:
| 2018-02-07 | 2019-02-05 | 2020-02-04 | 2021-02-08 | 2022-02-07 | 2023-02-07 | |
|---|---|---|---|---|---|---|
| Revenue (MM) | $21,146 | $21,965 | $22,428 | $9,048 | $15,790 | $23,814 |
| Gross Margins | 35.0% | 33.0% | 32.0% | -7.0% | 34.0% | 26.0% |
| Operating Margins | 16% | 15% | 13% | -42% | 11% | 4% |
| Net Margins | 16.0% | 11.0% | 10.0% | -34.0% | 6.0% | 2.0% |
| Net Income (MM) | $3,357 | $2,465 | $2,300 | -$3,074 | $977 | $539 |
| Net Interest Expense (MM) | -$79 | -$62 | -$28 | -$317 | -$454 | -$123 |
| Depreciation & Amort. (MM) | -$1,218 | -$1,201 | -$1,219 | -$1,255 | -$1,272 | -$1,351 |
| Earnings Per Share | $5.57 | $4.29 | $4.27 | -$5.44 | $1.61 | $0.89 |
| EPS Growth | n/a | -22.98% | -0.47% | -227.4% | 129.6% | -44.72% |
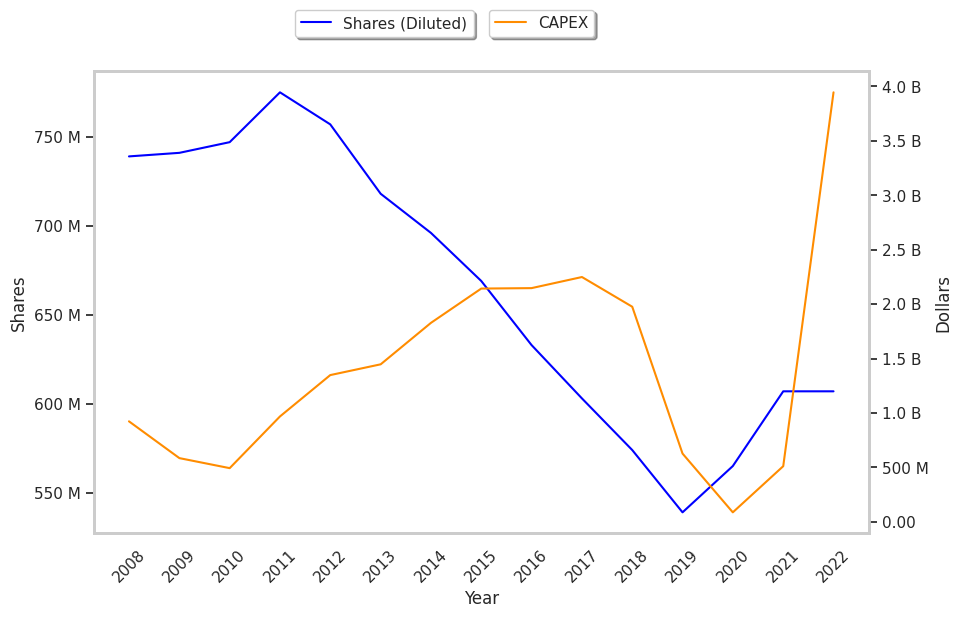
| Diluted Shares (MM) | 603 | 574 | 539 | 565 | 607 | 607 |
| Free Cash Flow (MM) | $6,178 | $6,869 | $4,614 | -$1,040 | $2,833 | $7,736 |
| Capital Expenditures (MM) | -$2,249 | -$1,976 | -$627 | -$87 | -$511 | -$3,946 |
| Net Current Assets (MM) | -$10,654 | -$11,362 | -$10,089 | -$10,539 | -$7,870 | -$9,874 |
| Long Term Debt (MM) | $3,320 | $2,771 | $1,846 | $10,111 | $10,274 | $8,046 |
| Net Debt / EBITDA | 0.09 | -0.07 | -0.34 | 1.17 | -1.6 | -1.78 |
Southwest Airlines Company has low leverage, wider gross margins than its peer group, and decent operating margins with a negative growth trend. However, the firm has declining EPS growth. Finally, we note that Southwest Airlines Company has weak revenue growth and a flat capital expenditure trend, irregular cash flows, and just enough current assets to cover current liabilities.