Semiconductors company First Solar stunned Wall Street today as it plummeted to $179.45, marking a -3.8% change compared to the S&P 500 and the Nasdaq indices, which logged -1.0% and -1.0% respectively. FSLR is -26.42% below its average analyst target price of $243.9, which implies there is more upside for the stock.
As such, the average analyst rates it at buy. Over the last year, First Solar shares have outperformed the S&P 500 by 20.0%, with a price change of 33.0%.
First Solar, Inc. provides photovoltaic (PV) solar energy solutions in the United State, Japan, France, Canada, India, Australia, and internationally. The company is a technology company. Valuations in the technology sector are often very high, as investors are willing to overlook gaps in the fundamentals if they believe a company’s innovations can dominate or create new markets.
First Solar's trailing 12 month P/E ratio is 122.1, based on its trailing EPS of $1.47. The company has a forward P/E ratio of 13.6 according to its forward EPS of $13.19 -- which is an estimate of what its earnings will look like in the next quarter. The average trailing Price to Earnings (P/E) ratio of US-based technology companies is 27.16 as of first quarter of 2023. In contrast, the S&P 500 average is 15.97. The P/E ratio is the company's share price divided by its earnings per share. In other words, it represents how much investors are willing to spend for each dollar of the company's earnings (revenues minus the cost of goods sold, taxes, and overhead).
FSLR’s price to earnings ratio can be divided by its projected five-year growth rate, to give us the price to earnings, or PEG ratio. This allows us to put its earnings valuation in the context of its growth expectations which is useful because companies with low P/E ratios often have low growth, which means they actually do not present an attractive value.
When we perform the calculation for First Solar, we obtain a PEG ratio of 4.3, which indicates that the company is overvalued compared to its growth prospects. The weakness with PEG ratios is that they rely on expected growth estimates, which of course may not turn out as expected.
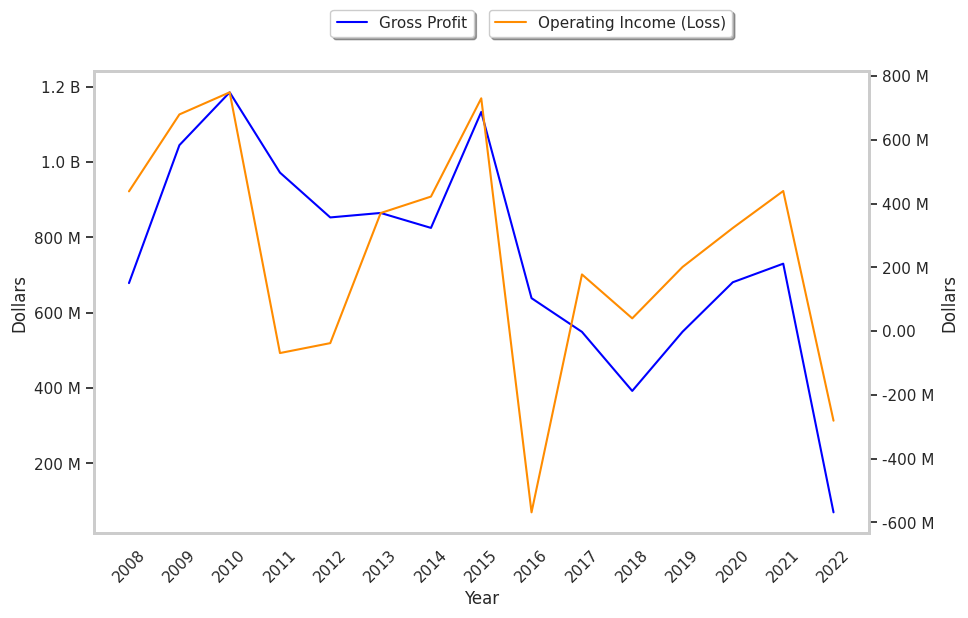
An analysis of the company's gross profit margins can help us understand its long term profitability and market position. Gross profits are the company's revenue minus the cost of goods only, and unlike earnings, don't take into account taxes and overhead. Here's an overview of First Solar's gross profit margin trends:
| Date Reported | Revenue ($ k) | Cost of Revenue ($ k) | Gross Margins (%) | YoY Growth (%) |
|---|---|---|---|---|
| 2023-02-28 | 2,619,319 | -2,549,461 | 3 | -88.0 |
| 2022-03-01 | 2,923,377 | -2,193,423 | 25 | 0.0 |
| 2021-02-26 | 2,711,332 | -2,030,659 | 25 | 38.89 |
| 2020-02-21 | 3,063,117 | -2,513,905 | 18 | 5.88 |
| 2019-02-22 | 2,244,044 | -1,851,867 | 17 | -10.53 |
| 2018-02-23 | 2,941,324 | -2,392,377 | 19 |
- Average gross margin: 17.8%
- Average gross margin growth rate: -1.9%
- Coefficient of variability (lower numbers indicating more stability): 45.2%
We can see from the above that First Solar business is not strong and its stock is likely not suitable for conservative investors.
Another key to assessing a company's health is to look at its free cash flow, which is calculated on the basis of its total cash flow from operating activities minus its capital expenditures. Capital expenditures are the costs of maintaining fixed assets such as land, buildings, and equipment. From First Solar's last four annual reports, we are able to obtain the following rundown of its free cash flow:
| Date Reported | Cash Flow from Operations ($ k) | Capital expenditures ($ k) | Free Cash Flow ($ k) | YoY Growth (%) |
|---|---|---|---|---|
| 2023-02-28 | 873,369 | -903,605 | 1,776,974 | 128.45 |
| 2022-03-01 | 237,559 | -540,291 | 777,850 | 71.43 |
| 2021-02-26 | 37,120 | -416,635 | 453,755 | -46.17 |
| 2020-02-21 | 174,201 | -668,717 | 842,918 | 104.08 |
| 2019-02-22 | -326,809 | -739,838 | 413,029 | -77.73 |
| 2018-02-23 | 1,340,677 | -514,357 | 1,855,034 |
- Average free cash flow: $1.02 Billion
- Average free cash flow growth rate: 0.0%
- Coefficient of variability (the lower the better): 2133316509.5%
Free cash flows represents the amount of money that is available for reinvesting in the business, or paying out to investors in the form of a dividend. With a positive cash flow as of the last fiscal year, FSLR is in a position to do either -- which can encourage more investors to place their capital in the company.
Value investors often analyze stocks through the lens of its Price to Book (P/B) Ratio (its share price divided by its book value). As of the first quarter of 2023, the mean P/B ratio of the technology sector is 6.23, compared to the S&P 500 average of 2.95. The book value refers to the present value of the company if the company were to sell off all of its assets and pay all of its debts today - a number whose value may differ significantly depending on the accounting method. First Solar's P/B ratio is 3.17, telling us that the market value of the company exceeds its book value by a factor of 3, but is still below the average P/B ratio of the Technology sector.
As of first quarter of 2023, First Solar is likely fairly valued because it has an inflated P/E ratio, a lower P/B ratio than its sector average, and irregular cash flows with a flat trend. The stock has poor growth indicators because of its weak operating margins with a negative growth trend, and an inflated PEG ratio. We hope this analysis will inspire you to do your own research into FSLR's fundamental values -- especially their trends over time.