Intel shares fell by -1.2% during the day's morning session, and are now trading at a price of $36.27. Is it time to buy the dip? To better answer that question, it's essential to check if the market is valuing the company's shares fairly in terms of its earnings and equity levels.
A Lower P/B Ratio Than Its Sector Average but Trades Above Its Graham Number:
Intel Corporation designs, develops, manufactures, markets, and sells computing and related products worldwide. The company belongs to the Technology sector, which has an average price to earnings (P/E) ratio of 27.16 and an average price to book (P/B) ratio of 6.23. In contrast, Intel has a trailing 12 month P/E ratio of -157.7 and a P/B ratio of 1.5.
Intel's PEG ratio is 7.23, which shows that the stock is probably overvalued in terms of its estimated growth. For reference, a PEG ratio near or below 1 is a potential signal that a company is undervalued.
Shareholders Are Confronted With a Declining EPS Growth Trend:
| 2018-02-16 | 2019-02-01 | 2020-01-24 | 2021-01-22 | 2022-01-27 | 2023-01-27 | |
|---|---|---|---|---|---|---|
| Revenue (MM) | $62,761 | $70,848 | $71,965 | $77,867 | $79,024 | $63,054 |
| Gross Margins | 62.0% | 62.0% | 59.0% | 56.0% | 55.0% | 43.0% |
| Operating Margins | 28% | 33% | 31% | 31% | 28% | 4% |
| Net Margins | 15.0% | 30.0% | 28.0% | 27.0% | 25.0% | 13.0% |
| Net Income (MM) | $9,601 | $21,053 | $21,048 | $20,899 | $19,868 | $8,014 |
| Earnings Per Share | $1.99 | $4.48 | $4.71 | $4.94 | $4.85 | $1.94 |
| EPS Growth | n/a | 125.13% | 5.13% | 4.88% | -1.82% | -60.0% |
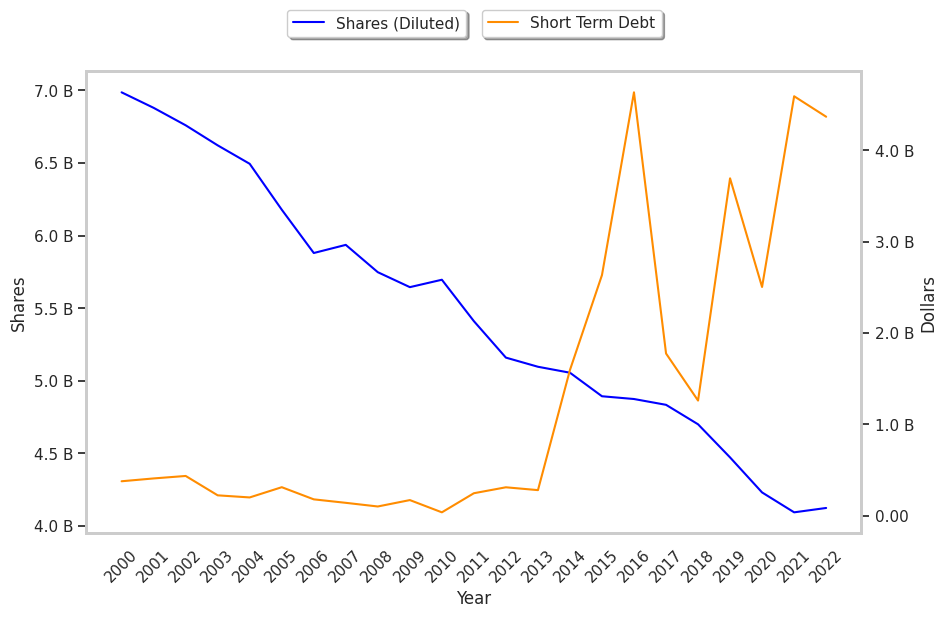
| Diluted Shares (MM) | 4,835 | 4,701 | 4,473 | 4,232 | 4,095 | 4,125 |
| Free Cash Flow (MM) | $33,888 | $44,613 | $49,358 | $50,123 | $48,189 | $40,277 |
| Capital Expenditures (MM) | -$11,778 | -$15,181 | -$16,213 | -$14,259 | -$18,733 | -$24,844 |
| Net Current Assets (MM) | -$24,730 | -$24,613 | -$27,781 | -$24,804 | -$14,457 | -$28,410 |
| Long Term Debt (MM) | $25,037 | $25,098 | $25,308 | $33,897 | $33,510 | $37,684 |
| Net Debt / EBITDA | 0.81 | 0.64 | 0.71 | 0.78 | 0.26 | 0.89 |
Intel has weak revenue growth and a flat capital expenditure trend, average net margins with a negative growth trend, and irregular cash flows. In addition, we note a decent current ratio. We also note that the company has healthy leverage working in its favor. However, the firm suffers from slimmer gross margins than its peers and declining EPS growth.