Now trading at a price of $423.94, Lockheed Martin has moved -4.8% so far today.
Over the last year, Lockheed Martin logged a 2.0% change, with its stock price reaching a high of $508.1 and a low of $381.55. Over the same period, the stock underperformed the S&P 500 index by -12.0%. As of April 2023, the company's 50-day average price was $453.54. Lockheed Martin Corporation, a security and aerospace company, engages in the research, design, development, manufacture, integration, and sustainment of technology systems, products, and services worldwide. Based in Bethesda, MD, the large-cap Industrials company has 116,000 full time employees. Lockheed Martin has offered a 2.7% dividend yield over the last 12 months.
Exceptional Profitability Overshadowed by Excessive Leverage:
| 2018-02-16 | 2019-02-08 | 2020-02-07 | 2021-01-28 | 2022-01-25 | 2023-01-26 | |
|---|---|---|---|---|---|---|
| Revenue (MM) | $49,960 | $53,762 | $59,812 | $65,398 | $67,044 | $65,984 |
| Gross Margins | 13.0% | 14.0% | 14.0% | 13.0% | 14.0% | 13.0% |
| Operating Margins | 13% | 14% | 14% | 13% | 14% | 13% |
| Net Margins | 4.0% | 9.0% | 10.0% | 10.0% | 9.0% | 9.0% |
| Net Income (MM) | $1,963 | $5,046 | $6,230 | $6,833 | $6,315 | $5,732 |
| Net Interest Expense (MM) | -$651 | -$668 | -$653 | -$591 | -$569 | -$623 |
| Depreciation & Amort. (MM) | -$1,195 | -$1,161 | -$1,189 | -$1,290 | -$1,364 | -$1,404 |
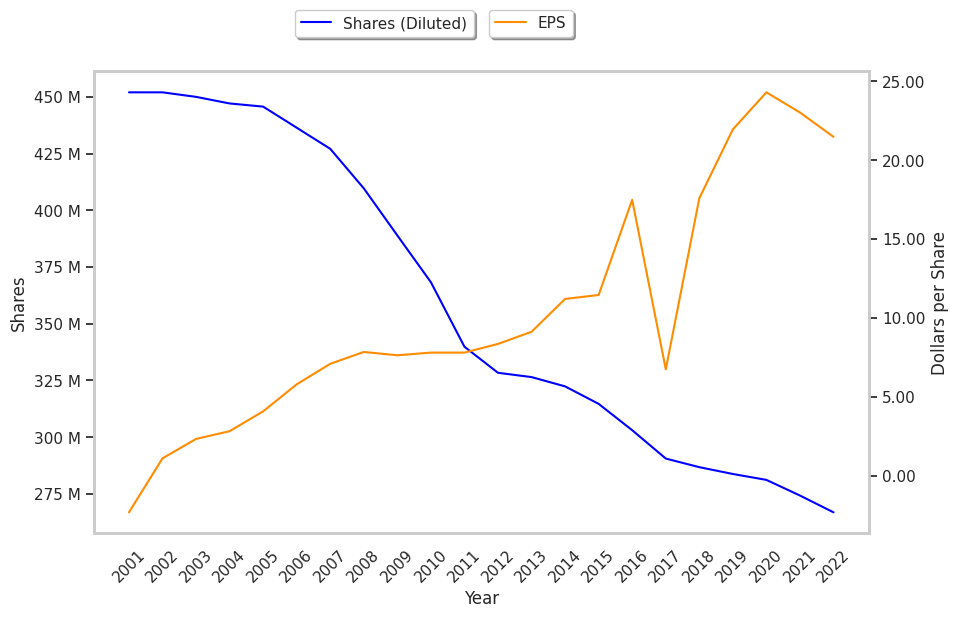
| Earnings Per Share | $6.75 | $17.59 | $21.95 | $24.3 | $23.02 | $21.48 |
| EPS Growth | n/a | 160.59% | 24.79% | 10.71% | -5.27% | -6.69% |
| Diluted Shares (MM) | 291 | 287 | 284 | 281 | 274 | 267 |
| Free Cash Flow (MM) | $7,653 | $4,416 | $8,795 | $9,949 | $10,743 | $9,472 |
| Capital Expenditures (MM) | -$1,177 | -$1,278 | -$1,484 | -$1,766 | -$1,522 | -$1,670 |
| Net Current Assets (MM) | -$29,891 | -$27,324 | -$27,262 | -$25,294 | -$20,099 | -$22,623 |
| Long Term Debt (MM) | $13,513 | $12,604 | $11,404 | $11,669 | $11,670 | $15,429 |
Lockheed Martin has weak revenue growth and a flat capital expenditure trend, irregular cash flows, and just enough current assets to cover current liabilities. We also note that the company benefits from strong margins with a stable trend and exceptional EPS growth. However, the firm suffers from slimmer gross margins than its peers and high levels of debt.
A Very Low P/E Ratio but Trades Above Its Graham Number:
Lockheed Martin has a trailing twelve month P/E ratio of 16.6, compared to an average of 20.49 for the Industrials sector. Based on its EPS guidance of $28.1, the company has a forward P/E ratio of 16.1. The company doesn't provide forward earnings guidance, and the compound average growth rate of its last 6 years of reported EPS is 26.2%. On this basis, Lockheed Martin's PEG ratio is 0.63. Using instead the 10.6% weighted average of Lockheed Martin's earnings CAGR and the broader market's anticipated 5-year EPS growth rate, the company's PEG ratio is 1.56, which suggests that its shares may be overpriced. Furthermore, Lockheed Martin is likely overvalued compared to the book value of its equity, since its P/B ratio of 11.52 is higher than the sector average of 3.78. The company's shares are currently trading 227.3% above their Graham number.
Lockheed Martin Has an Average Rating of Hold:
The 20 analysts following Lockheed Martin have set target prices ranging from $374.0 to $570.0 per share, for an average of $502.85 with a hold rating. As of April 2023, the company is trading -9.8% away from its average target price, indicating that there is an analyst consensus of some upside potential.
Lockheed Martin has a very low short interest because 0.7% of the company's shares are sold short. Institutions own 76.1% of the company's shares, and the insider ownership rate stands at 0.07%, suggesting a small amount of insider investors. The largest shareholder is State Street Corporation, whose 15% stake in the company is worth $16,067,891,204.