Advanced Micro Devices does not have the profile of a defensive investment based on the requirements of Ben Graham. The Semiconductors firm may nonetheless be of interest to more risk-oriented investors who have a solid thesis on the company's future growth. At Market Inference, we remain agnostic as to such further developments, and prefer to use a company's past track record as the bellwether for future potential gains.
Advanced Micro Devices Is Probably Overvalued
Graham devised the below equation to give investors a quick way of determining whether a stock is trading at a fair multiple of its earnings and its assets:
√(22.5 * 6 year average earnings per share (1.01) * 6 year average book value per share (34.161) = $25.66
After an impressive 29.0% performance over the 12 months, Advanced Micro Devices is now trading well over its price because its Graham number is 315.3% above today's share price of $106.57. Even though the stock does not trade at an attractive multiple, it might still meet some of the other criteria for quality stocks that Graham listed in Chapter 14 of The Intelligent Investor.
Impressive Growth, but Inconsistent Profitability and no Dividend
Advanced Micro Devices’s average sales revenue over the last 6 years has been $14.56 Billion, so by Graham’s standards the company is large enough to warrant an investment. When published in 1972, Graham’s threshold was $100 million in average sales, which would be the equivalent of around a half million dollars today. Needless to say, this is the least important of Graham's requirements, and may be overlooked by all but the most conservative investors.
More importantly, Ben Graham believed that a margin of safety could be obtained by investing in companies with consistently positive retained earnings. Advanced Micro Devices had negative retained earnings in 2019, 2020, and 2021 with an average of $-5645357142.857142 over this period. So the company is not accumulating enough cash over time by Graham's standards.
Graham also required a 30% or more cumulative growth rate of the company's earnings per share over the last ten years.To determine Advanced Micro Devices's EPS growth over time, we will average out its EPS for 2008, 2009, and 2010, which were $-5.15, $0.45, and $0.50 respectively. This gives us an average of $-1.40 for the period of 2008 to 2010. Next, we compare this value with the average EPS reported in 2020, 2021, and 2022, which were $1.45, $2.57, and $0.84, for an average of $1.62. Now we see that Advanced Micro Devices's EPS growth was 215.71% during this period, which satisfies Ben Graham's requirement.
We have no record of Advanced Micro Devices offering a regular dividend.
Advanced Micro Devices’s Balance Sheet Meets Graham’s Criteria
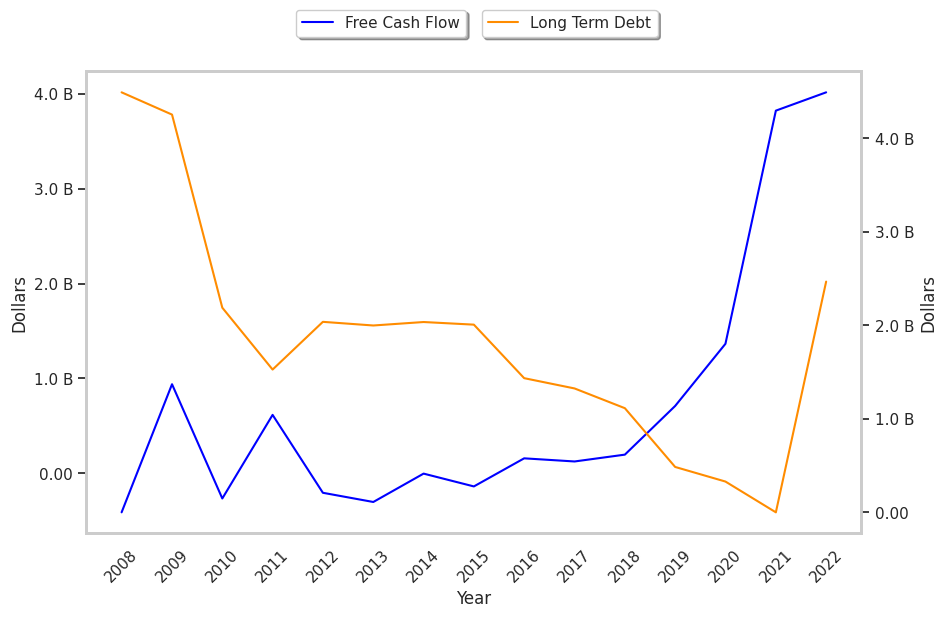
It was also essential to Graham that the company’s current assets outweigh its current liabilities, and that its long term debt be inferior to the sum of its net current assets (current assets minus total liabilities). This is the aspect of the analysis that most companies fail, yet Advanced Micro Devices passes comfortably, with an average current ratio of 2.4, and average debt to net current asset ratio of 1.1.
Conclusion
According to Graham's analysis, Advanced Micro Devices is likely a company of average quality, which does not offer a significant enough margin of safety for a risk averse investor.
| 2018-02-27 | 2019-02-08 | 2020-02-04 | 2021-01-29 | 2022-02-03 | 2023-02-27 | |
|---|---|---|---|---|---|---|
| Revenue (MM) | $5,253 | $6,475 | $6,731 | $9,763 | $16,434 | $23,601 |
| Gross Margins | 34.0% | 38.0% | 43.0% | 45.0% | 48.0% | 45.0% |
| Operating Margins | 1% | 7% | 8% | 14% | 22% | 5% |
| Net Margins | -1.0% | 5.0% | 5.0% | 26.0% | 19.0% | 6.0% |
| Net Income (MM) | -$33 | $337 | $341 | $2,490 | $3,162 | $1,320 |
| Net Interest Expense (MM) | -$126 | -$121 | -$94 | -$47 | -$34 | -$88 |
| Depreciation & Amort. (MM) | -$144 | -$170 | -$222 | -$312 | -$407 | -$4,174 |
| Earnings Per Share | -$0.03 | $0.32 | $0.3 | $2.06 | $2.57 | $0.84 |
| EPS Growth | n/a | 1166.67% | -6.25% | 586.67% | 24.76% | -67.32% |
| Diluted Shares (MM) | 1,039 | 1,064 | 1,120 | 1,207 | 1,230 | 1,571 |
| Free Cash Flow (MM) | $125 | $197 | $710 | $1,365 | $3,822 | $4,015 |
| Capital Expenditures (MM) | -$113 | -$163 | -$217 | -$294 | -$301 | -$450 |
| Net Current Assets (MM) | -$322 | $250 | $1,396 | $3,018 | $3,661 | $2,189 |
| Long Term Debt (MM) | $1,325 | $1,114 | $486 | $330 | $1 | $2,467 |