Now trading at a price of $66.59, Centene has moved 5.2% so far today.
Centene returned losses of -27.0% last year, with its stock price reaching a high of $93.58 and a low of $60.83. Over the same period, the stock underperformed the S&P 500 index by -40.0%. As of April 2023, the company's 50-day average price was $65.98. Centene Corporation operates as a healthcare enterprise that provides programs and services to under-insured and uninsured families, commercial organizations, and military families in the United States. Based in Saint Louis, MO, the large-cap Health Care company has 74,300 full time employees. Centene has not offered a dividend during the last year.
Overview of the Company's Finances:
| 2018-02-20 | 2019-02-19 | 2020-02-18 | 2021-02-22 | 2022-02-22 | 2023-02-21 | |
|---|---|---|---|---|---|---|
| Revenue (MM) | $48,382 | $60,116 | $74,639 | $111,115 | $125,982 | $144,547 |
| Operating Margins | 2% | 2% | 3% | 3% | 3% | 3% |
| Net Margins | 2.0% | 1.0% | 2.0% | 2.0% | 1.0% | 1.0% |
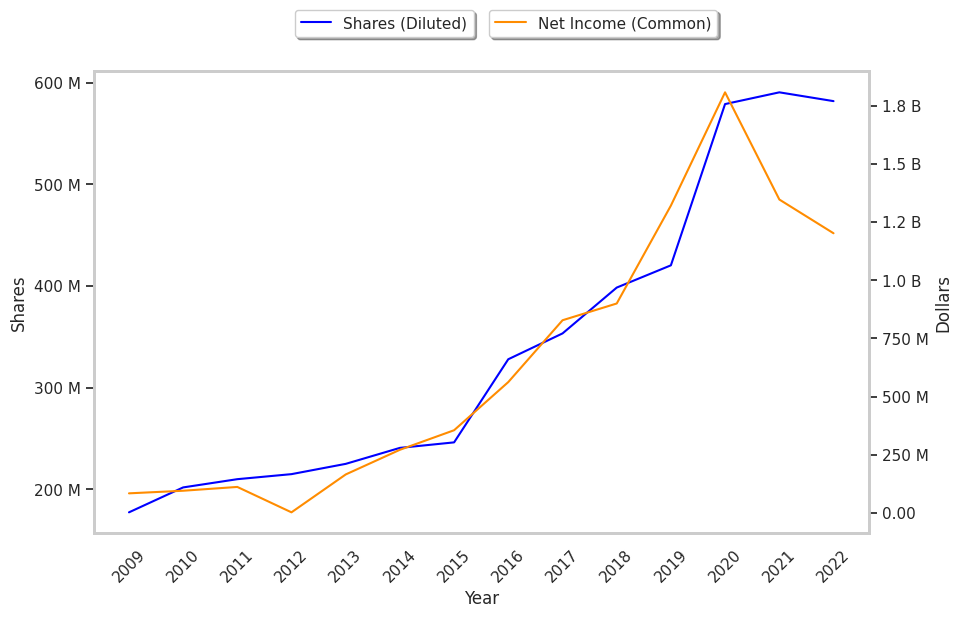
| Net Income (MM) | $828 | $900 | $1,321 | $1,808 | $1,347 | $1,202 |
| Net Interest Expense (MM) | -$255 | -$343 | -$412 | -$728 | -$665 | -$665 |
| Depreciation & Amort. (MM) | -$361 | -$495 | -$643 | -$1,259 | -$1,476 | -$1,553 |
| Earnings Per Share | $2.34 | $2.26 | $3.14 | $3.12 | $2.28 | $2.07 |
| EPS Growth | n/a | -3.42% | 38.94% | -0.64% | -26.92% | -9.21% |
| Diluted Shares (MM) | 353 | 399 | 420 | 579 | 591 | 582 |
| Free Cash Flow (MM) | $1,911 | $1,909 | $2,213 | $6,372 | $5,115 | $7,265 |
| Capital Expenditures (MM) | -$422 | -$675 | -$730 | -$869 | -$910 | -$1,004 |
| Net Current Assets (MM) | -$6,276 | -$7,880 | -$7,979 | -$19,364 | -$22,856 | -$22,505 |
| Long Term Debt (MM) | $4,695 | $6,648 | $13,638 | $16,682 | $18,571 | $17,938 |
| Net Debt / EBITDA | 0.06 | 0.32 | 0.27 | 1.0 | 0.88 | 0.7 |
Centene has weak revenue growth and a flat capital expenditure trend, weak operating margings with a stable trend, and irregular cash flows. In addition, we note just enough current assets to cover current liabilities. We also note that the company benefits from a strong EPS growth trend and healthy leverage. Furthermore, Centene's financial statements do not display any obvious red flags.
A Lower P/B Ratio Than Its Sector Average but Trades Above Its Graham Number:
Centene has a trailing twelve month P/E ratio of 13.6, compared to an average of 24.45 for the Health Care sector. Based on its EPS guidance of $6.69, the company has a forward P/E ratio of 9.9. The company doesn't provide forward earnings guidance, and the compound average growth rate of its last 6 years of reported EPS is 12.9%. On this basis, Centene's PEG ratio is 1.05. Using instead the 9.2% weighted average of Centene's earnings CAGR and the broader market's anticipated 5-year EPS growth rate, the company's PEG ratio is 1.48, which shows that its shares might be fairly priced. Additionally, the market is possibly undervaluing Centene in terms of its equity because its P/B ratio is 1.42 whereas the sector average is 4.16. The company's shares are currently trading 51.2% above their Graham number.
Centene Has an Average Rating of Buy:
The 19 analysts following Centene have set target prices ranging from $71.0 to $110.0 per share, for an average of $81.68 with a buy rating. As of April 2023, the company is trading -19.2% away from its average target price, indicating that there is an analyst consensus of some upside potential.
Centene has a very low short interest because 1.3% of the company's shares are sold short. Institutions own 97.2% of the company's shares, and the insider ownership rate stands at 0.65%, suggesting a small amount of insider investors. The largest shareholder is Vanguard Group Inc, whose 12% stake in the company is worth $4,244,655,296.