It hasn't been a great morning session for First Solar investors, who have watched their shares sink by -2.4% to a price of $177.78. Some of you might be wondering if it's time to buy the dip. If you are considering this, make sure to check the company's fundamentals first to determine if the shares are fairly valued at today's prices.
First Solar Has an Attractive P/B Ratio but a Worrisome P/E Ratio:
First Solar, Inc. provides photovoltaic (PV) solar energy solutions in the United State, Japan, France, Canada, India, Australia, and internationally. The company belongs to the Technology sector, which has an average price to earnings (P/E) ratio of 27.16 and an average price to book (P/B) ratio of 6.23. In contrast, First Solar has a trailing 12 month P/E ratio of 120.9 and a P/B ratio of 3.14.
First Solar's PEG ratio is 4.2, which shows that the stock is probably overvalued in terms of its estimated growth. For reference, a PEG ratio near or below 1 is a potential signal that a company is undervalued.
An Exceptionally Strong Balance Sheet:
| 2018-02-23 | 2019-02-22 | 2020-02-21 | 2021-02-26 | 2022-03-01 | 2023-02-28 | |
|---|---|---|---|---|---|---|
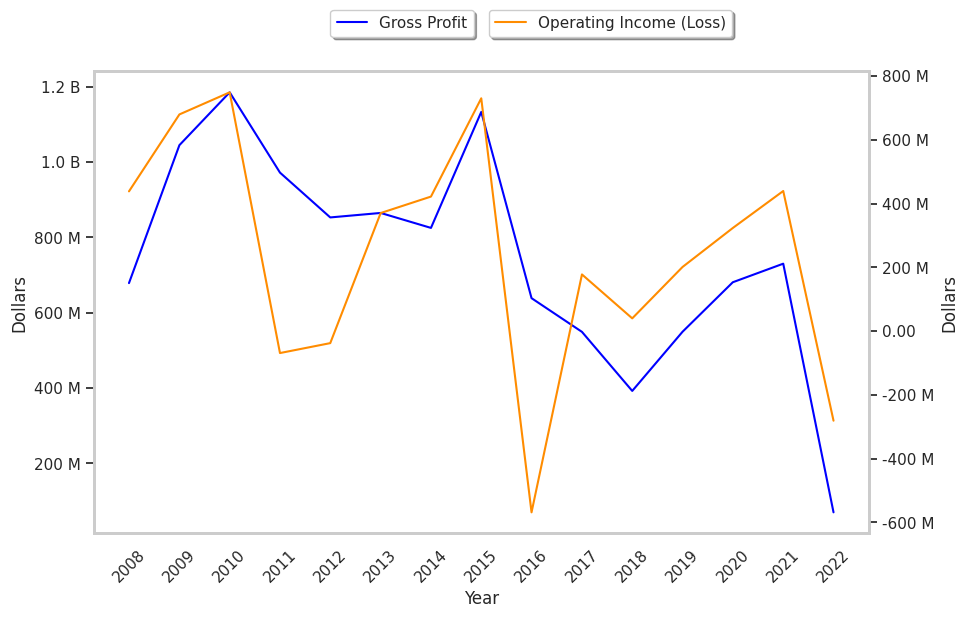
| Revenue (MM) | $2,941 | $2,244 | $3,063 | $2,711 | $2,923 | $2,619 |
| Gross Margins | 19.0% | 17.0% | 18.0% | 25.0% | 25.0% | 3.0% |
| Operating Margins | 6% | 2% | 7% | 12% | 15% | -11% |
| Net Margins | -6.0% | 6.0% | -4.0% | 15.0% | 16.0% | -2.0% |
| Net Income (MM) | -$166 | $144 | -$115 | $398 | $469 | -$44 |
| Net Interest Expense (MM) | -$26 | $34 | $22 | -$7 | -$7 | $21 |
| Depreciation & Amort. (MM) | -$115 | -$131 | -$205 | -$233 | -$260 | -$270 |
| Earnings Per Share | -$1.59 | $1.36 | -$1.09 | $3.73 | $4.38 | -$0.41 |
| EPS Growth | n/a | 185.53% | -180.15% | 442.2% | 17.43% | -109.36% |
| Diluted Shares (MM) | 104 | 106 | 105 | 107 | 107 | 107 |
| Free Cash Flow (MM) | $1,855 | $413 | $843 | $454 | $778 | $1,777 |
| Capital Expenditures (MM) | -$514 | -$740 | -$669 | -$417 | -$540 | -$904 |
| Net Current Assets (MM) | $2,067 | $1,951 | $1,181 | $1,427 | $1,737 | $1,376 |
| Long Term Debt (MM) | $380 | $461 | $454 | $238 | $236 | $184 |
First Solar has an excellent current ratio, healthy debt levels, and a strong EPS growth trend. However, the firm suffers from slimmer gross margins than its peers and weak operating margins with a negative growth trend. Finally, we note that First Solar has weak revenue growth and a flat capital expenditure trend and irregular cash flows.