MarketAxess shares fell by -1.3% during the day's morning session, and are now trading at a price of $225.84. Is it time to buy the dip? To better answer that question, it's essential to check if the market is valuing the company's shares fairly in terms of its earnings and equity levels.
The Market May Be Overvaluing MarketAxess's Earnings and Assets:
MarketAxess Holdings Inc., together with its subsidiaries, operates an electronic trading platform for institutional investor and broker-dealer companies worldwide. The company belongs to the Finance sector, which has an average price to earnings (P/E) ratio of 14.34 and an average price to book (P/B) ratio of 1.57. In contrast, MarketAxess has a trailing 12 month P/E ratio of 33.7 and a P/B ratio of 7.3.
MarketAxess's PEG ratio is 2.69, which shows that the stock is probably overvalued in terms of its estimated growth. For reference, a PEG ratio near or below 1 is a potential signal that a company is undervalued.
The Company Has a Positive Net Current Asset Value:
| 2018-02-23 | 2019-03-18 | 2020-02-18 | 2021-02-19 | 2022-02-23 | 2023-02-22 | |
|---|---|---|---|---|---|---|
| Revenue (k) | $393,422 | $435,565 | $511,352 | $689,125 | $698,951 | $718,300 |
| Interest Income (k) | n/a | n/a | n/a | $1,304 | -$441 | $4,340 |
| Operating Margins | 51% | 49% | 49% | 54% | 48% | 46% |
| Net Margins | 38.0% | 40.0% | 40.0% | 43.0% | 37.0% | 35.0% |
| Net Income (k) | $148,089 | $172,852 | $204,902 | $299,377 | $257,888 | $250,224 |
| Depreciation & Amort. (k) | -$19,274 | -$23,080 | -$26,857 | -$35,996 | -$53,447 | -$61,446 |
| Earnings Per Share | $3.89 | $4.57 | $5.4 | $7.85 | $6.77 | $6.65 |
| EPS Growth | n/a | 17.48% | 18.16% | 45.37% | -13.76% | -1.77% |
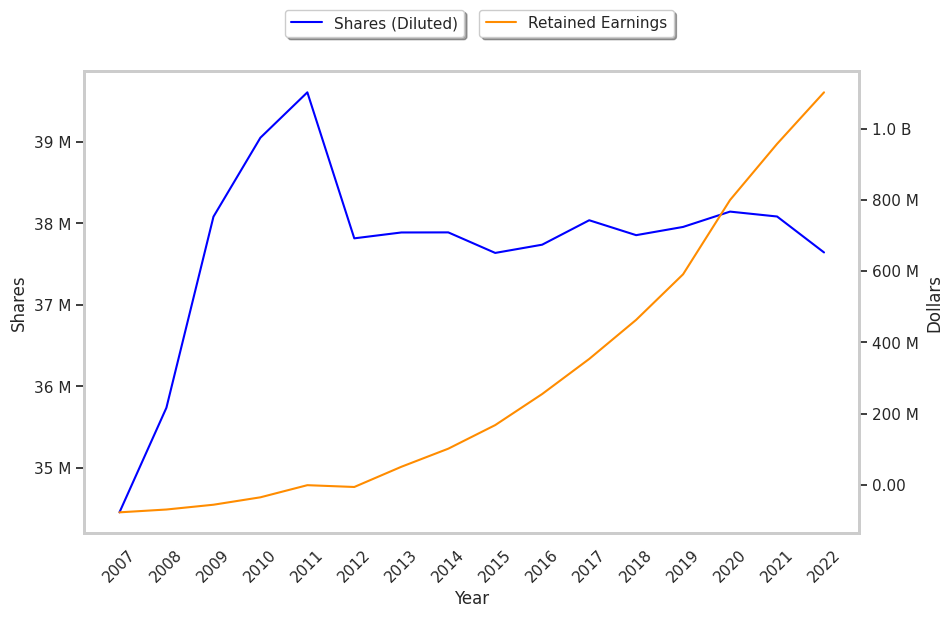
| Diluted Shares (k) | 38,038 | 37,855 | 37,956 | 38,144 | 38,084 | 37,643 |
| Free Cash Flow (k) | $180,121 | $259,805 | $278,227 | $419,499 | $299,584 | $302,373 |
| Capital Expenditures | -$12,086 | -$35,888 | -$12,292 | -$15,010 | -$17,493 | -$13,142 |
| Net Current Assets (k) | n/a | n/a | n/a | n/a | n/a | n/a |
MarketAxess has strong margins with a stable trend, an excellent current ratio, and positive EPS growth. Furthermore, MarketAxess has weak revenue growth and a flat capital expenditure trend and irregular cash flows.