Based on the factors that Benjamin Graham considered in analyzing potential stock picks, Tenet Healthcare is not a quality investment. Only investors with a high risk tolerance and a solid investment thesis on the stock will be interested in this mid-cap Medical Care Facility company.
Tenet Healthcare Is Probably Overvalued
Graham devised the below equation to give investors a quick way of determining whether a stock is trading at a fair multiple of its earnings and its assets:
√(22.5 * 6 year average earnings per share (1.3) * 6 year average book value per share (13.23) = $58.92
At today's price of $73.05 per share, Tenet Healthcare is now trading 24.0% above the maximum price that Graham would have wanted to pay for the stock.
Even though the stock does not trade at an attractive multiple, it might still meet some of the other criteria for quality stocks that Graham listed in Chapter 14 of The Intelligent Investor.
Impressive Growth, but Inconsistent Profitability and no Dividend
Tenet Healthcare’s average sales revenue over the last 6 years has been $28.07 Billion, so by Graham’s standards the company is large enough to warrant an investment. When published in 1972, Graham’s threshold was $100 million in average sales, which would be the equivalent of around a half million dollars today. Needless to say, this is the least important of Graham's requirements, and may be overlooked by all but the most conservative investors.
More importantly, Ben Graham believed that a margin of safety could be obtained by investing in companies with consistently positive retained earnings. Tenet Healthcare had negative retained earnings in 2019, 2020, and 2021 with an average of $-1734071428.5714285 over this period. So the company is not accumulating enough cash over time by Graham's standards.
Graham also required a 30% or more cumulative growth rate of the company's earnings per share over the last ten years.To determine Tenet Healthcare's EPS growth over time, we will average out its EPS for 2008, 2009, and 2010, which were $0.05, $0.37, and $8.16 respectively. This gives us an average of $2.86 for the period of 2008 to 2010. Next, we compare this value with the average EPS reported in 2020, 2021, and 2022, which were $3.75, $8.42, and $3.79, for an average of $5.32. Now we see that Tenet Healthcare's EPS growth was 86.01% during this period, which satisfies Ben Graham's requirement.
We have no record of Tenet Healthcare offering a regular dividend.
Negative Current Asset to Liabilities Balance and an Average Current Ratio
Graham sought companies with extremely low debt levels compared to their assets. For one, he expected their current ratio to be over 2 and their long term debt to net current asset ratio to be near, or ideally under, under 1. Tenet Healthcare fails on both counts with a current ratio of 1.3 and a debt to net current asset ratio of -0.9.
According to Graham's analysis, Tenet Healthcare is likely a company of low quality, which is trading far above its fair price.
| 2018-02-26 | 2019-02-25 | 2020-02-24 | 2021-02-19 | 2022-02-18 | 2023-02-21 | |
|---|---|---|---|---|---|---|
| Revenue (MM) | $19,179 | $18,313 | $18,479 | $18,522 | $19,676 | $19,368 |
| Gross Margins | 36.0% | 36.0% | 36.0% | 84.0% | 83.0% | 83.0% |
| Operating Margins | 7% | 9% | 9% | 12% | 12% | 12% |
| Net Margins | -4.0% | 1.0% | -1.0% | 2.0% | 5.0% | 2.0% |
| Net Income (MM) | -$704 | $104 | -$215 | $399 | $916 | $409 |
| Net Interest Expense (MM) | -$1,028 | -$1,004 | -$985 | -$1,003 | -$923 | -$890 |
| Depreciation & Amort. (MM) | -$870 | -$802 | -$850 | -$857 | -$855 | -$841 |
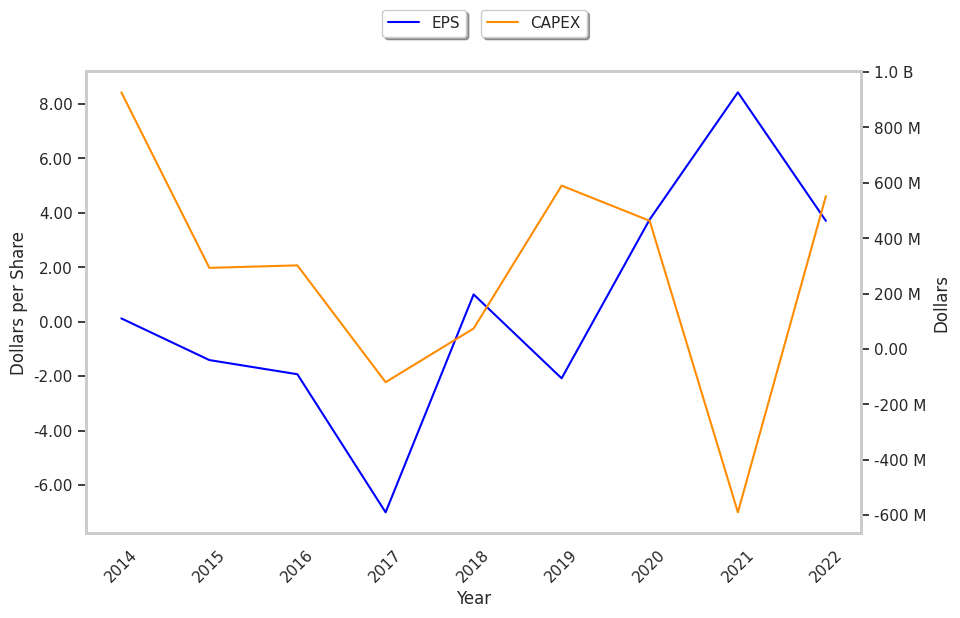
| Earnings Per Share | -$7.0 | $1.0 | -$2.08 | $3.75 | $8.42 | $3.7 |
| EPS Growth | n/a | 114.29% | -308.0% | 280.29% | 124.53% | -56.06% |
| Diluted Shares (MM) | 101 | 104 | 103 | 106 | 109 | 111 |
| Free Cash Flow (MM) | $1,080 | $1,123 | $1,823 | $3,870 | $978 | $1,635 |
| Capital Expenditures (MM) | $120 | -$74 | -$590 | -$463 | $590 | -$552 |
| Net Current Assets (MM) | -$15,407 | -$15,666 | -$16,341 | -$17,070 | -$16,247 | -$16,567 |
| Long Term Debt (MM) | $14,791 | $14,644 | $14,580 | $15,574 | $15,511 | $14,934 |
| Net Debt / EBITDA | 6.34 | 5.98 | 5.68 | 4.43 | 4.07 | 4.37 |