Now trading at a price of $180.41, American Tower has moved -1.2% so far today.
American Tower returned losses of -30.0% last year, with its stock price reaching a high of $265.56 and a low of $172.55. Over the same period, the stock underperformed the S&P 500 index by -41.0%. As of April 2023, the company's 50-day average price was $186.44. American Tower, one of the largest global REITs, is a leading independent owner, operator and developer of multitenant communications real estate with a portfolio of nearly 226,000 communications sites and a highly interconnected footprint of U. Based in Boston, MA, the large-cap Real Estate company has 6,391 full time employees. American Tower has offered a 3.4% dividend yield over the last 12 months.
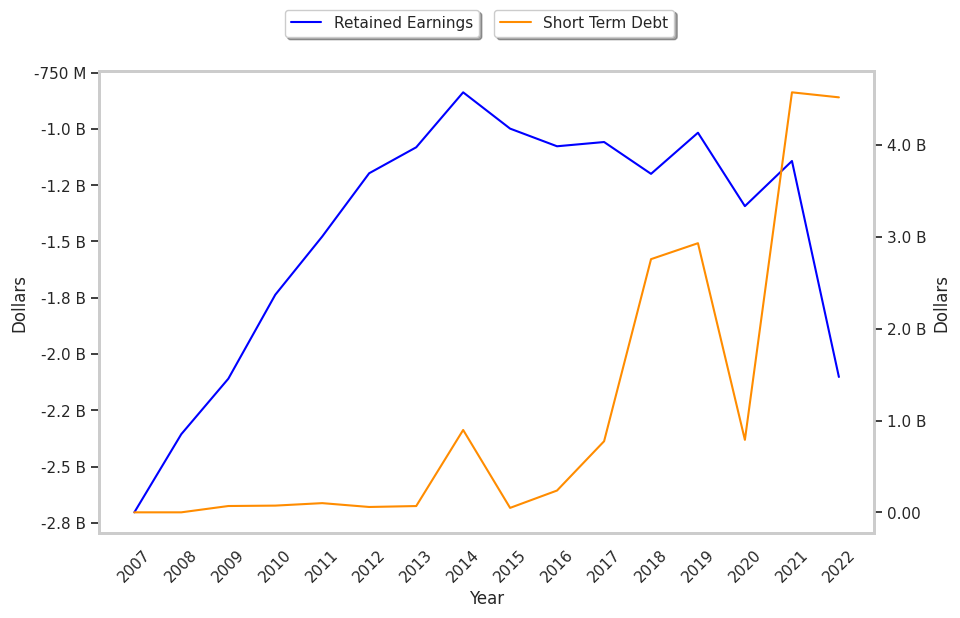
The Company May Be Profitable, but Its Balance Sheet Is Highly Leveraged:
| 2018-02-28 | 2019-02-27 | 2020-02-25 | 2021-02-25 | 2022-02-25 | 2023-02-23 | |
|---|---|---|---|---|---|---|
| Revenue (MM) | $6,664 | $7,440 | $7,580 | $8,042 | $9,357 | $10,711 |
| Operating Margins | 30% | 26% | 35% | 36% | 33% | 22% |
| Net Margins | 19.0% | 17.0% | 25.0% | 21.0% | 27.0% | 16.0% |
| Net Income (MM) | $1,239 | $1,236 | $1,888 | $1,691 | $2,568 | $1,766 |
| Net Interest Expense (MM) | -$703 | -$771 | -$767 | -$754 | -$830 | -$1,065 |
| Depreciation & Amort. (MM) | -$1,716 | -$2,111 | -$1,778 | -$1,882 | -$2,333 | -$3,355 |
| Earnings Per Share | $2.67 | $2.77 | $4.24 | $3.79 | $5.62 | $3.82 |
| EPS Growth | n/a | 3.75% | 53.07% | -10.61% | 48.28% | -32.03% |
| Diluted Shares (MM) | 432 | 443 | 446 | 446 | 457 | 463 |
| Free Cash Flow (MM) | $3,729 | $4,662 | $4,744 | $4,913 | $6,197 | $5,570 |
| Capital Expenditures (MM) | -$804 | -$913 | -$991 | -$1,032 | -$1,377 | -$1,874 |
| Net Current Assets (MM) | -$23,222 | -$23,721 | -$33,661 | -$39,547 | -$57,089 | -$51,164 |
| Long Term Debt (MM) | $19,430 | $18,405 | $21,127 | $28,498 | $38,686 | $34,156 |
| Net Debt / EBITDA | 5.22 | 4.97 | 5.05 | 5.77 | 7.56 | 6.42 |
American Tower's P/B and P/E Ratios Are Higher Than Average:
American Tower has a trailing twelve month P/E ratio of 91.4, compared to an average of 24.81 for the Real Estate sector. Based on its EPS guidance of $4.82, the company has a forward P/E ratio of 38.7. The company doesn't issue forward earnings guidance, and the compound average growth rate of its last 6 years of reported EPS is -4.4%. On this basis, the company's PEG ratio is -20.84, which indicates that its shares are overpriced. Furthermore, American Tower is likely overvalued compared to the book value of its equity, since its P/B ratio of 16.28 is higher than the sector average of 2.24. The company's shares are currently trading 275.8% above their Graham number.
Analysts Give American Tower an Average Rating of Buy:
The 17 analysts following American Tower have set target prices ranging from $205.0 to $271.0 per share, for an average of $232.35 with a buy rating. As of April 2023, the company is trading -19.8% away from its average target price, indicating that there is an analyst consensus of strong upside potential.
American Tower has a very low short interest because 1.2% of the company's shares are sold short. Institutions own 92.8% of the company's shares, and the insider ownership rate stands at 0.15%, suggesting a small amount of insider investors. The largest shareholder is Vanguard Group Inc, whose 13% stake in the company is worth $10,957,259,433.