It's been a great morning session for Albemarle investors, who saw their shares rise 1.1% to a price of $186.38 per share. At these higher prices, is the company still fairly valued? If you are thinking about investing, make sure to check the company's fundamentals before making a decision.
The Market May Be Undervaluing Albemarle's Earnings and Assets:
Albemarle Corporation develops, manufactures, and markets engineered specialty chemicals worldwide. The company belongs to the Industrials sector, which has an average price to earnings (P/E) ratio of 20.49 and an average price to book (P/B) ratio of 3.78. In contrast, Albemarle has a trailing 12 month P/E ratio of 5.6 and a P/B ratio of 2.23.
Albemarle's PEG ratio is 2.21, which shows that the stock is probably overvalued in terms of its estimated growth. For reference, a PEG ratio near or below 1 is a potential signal that a company is undervalued.
Wider Gross Margins Than the Industry Average of 17.85%:
| 2018-02-28 | 2019-02-27 | 2020-04-15 | 2021-02-19 | 2022-02-22 | 2023-02-15 | |
|---|---|---|---|---|---|---|
| Revenue (MM) | $3,072 | $3,375 | $3,589 | $3,129 | $3,328 | $7,320 |
| Gross Margins | 36.0% | 36.0% | 35.0% | 32.0% | 30.0% | 42.0% |
| Operating Margins | 19% | 21% | 19% | 16% | 15% | 34% |
| Net Margins | 2.0% | 21.0% | 15.0% | 12.0% | 4.0% | 37.0% |
| Net Income (MM) | $55 | $694 | $533 | $376 | $124 | $2,690 |
| Net Interest Expense (MM) | -$115 | -$52 | -$58 | -$73 | -$61 | -$123 |
| Depreciation & Amort. (MM) | -$197 | -$201 | -$213 | -$232 | -$254 | -$301 |
| Earnings Per Share | $0.49 | $6.34 | $5.02 | $3.52 | $1.06 | $22.84 |
| EPS Growth | n/a | 1193.88% | -20.82% | -29.88% | -69.89% | 2054.72% |
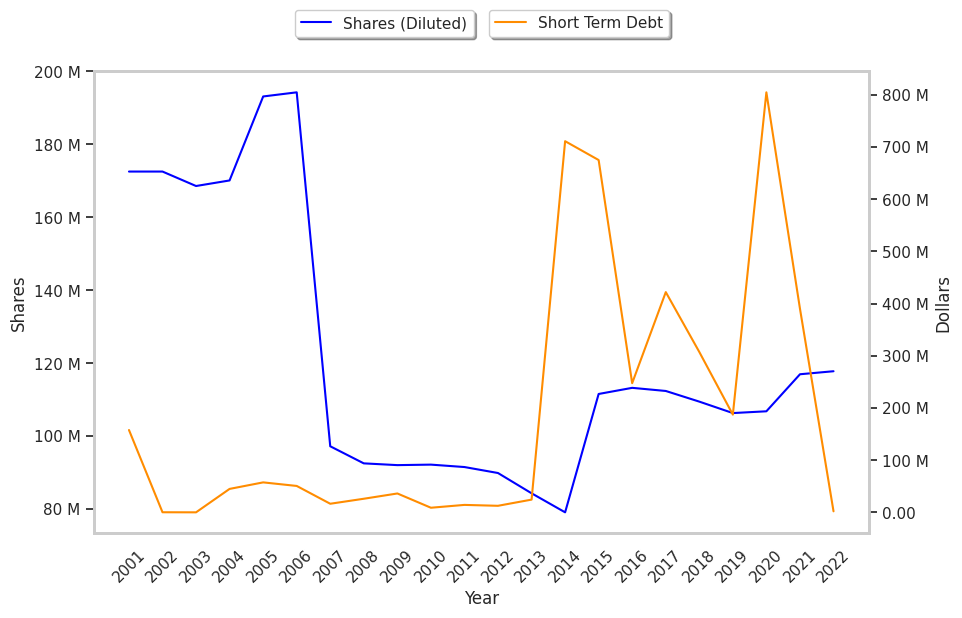
| Diluted Shares (MM) | 112 | 109 | 106 | 107 | 117 | 118 |
| Free Cash Flow (MM) | $622 | $1,246 | $1,561 | $1,649 | $1,298 | $3,169 |
| Capital Expenditures (MM) | -$318 | -$700 | -$841 | -$850 | -$954 | -$1,262 |
| Net Current Assets (MM) | -$1,456 | -$1,824 | -$3,542 | -$3,776 | -$3,175 | -$2,079 |
| Long Term Debt (MM) | $1,415 | $1,398 | $2,863 | $2,767 | $2,004 | $3,215 |
| Net Debt / EBITDA | 0.89 | 1.28 | 2.77 | 3.83 | 2.58 | 0.62 |
Albemarle has exceptional EPS growth and low leverage. Additionally, the company's financial statements display wider gross margins than its peer group and decent operating margins with a positive growth rate. Furthermore, Albemarle has weak revenue growth and a flat capital expenditure trend, irregular cash flows, and a decent current ratio.