A strong performer from today's morning trading session is Amazon.com, whose shares rose 2.1% to $141.17 per share. For those of you thinking about investing in the stock, here is a brief value analysis of the stock using the company's basic fundamental ratios.
Amazon.com Has Elevated P/B and P/E Ratios:
Amazon.com, Inc. engages in the retail sale of consumer products and subscriptions through online and physical stores in North America and internationally. The company belongs to the Consumer Discretionary sector, which has an average price to earnings (P/E) ratio of 22.33 and an average price to book (P/B) ratio of 3.12. In contrast, Amazon.com has a trailing 12 month P/E ratio of 110.3 and a P/B ratio of 8.64.
When we divideAmazon.com's P/E ratio by its expected five-year EPS growth rate, we obtain a PEG ratio of 0.75, which indicates that the market is undervaluing the company's projected growth (a PEG ratio of 1 indicates a fairly valued company). Your analysis of the stock shouldn't end here. Rather, a good PEG ratio should alert you that it may be worthwhile to take a closer look at the stock.
Healthy Debt Levels and Exceptional EPS Growth:
| 2018-02-02 | 2019-02-01 | 2020-01-31 | 2021-02-03 | 2022-02-04 | 2023-01-28 | |
|---|---|---|---|---|---|---|
| Revenue (MM) | $177,866 | $232,887 | $280,522 | $386,064 | $469,822 | $513,983 |
| Gross Margins | 37.0% | 40.0% | 41.0% | 40.0% | 42.0% | 44.0% |
| Operating Margins | 2% | 5% | 5% | 6% | 5% | 2% |
| Net Margins | 2.0% | 4.0% | 4.0% | 6.0% | 7.0% | -1.0% |
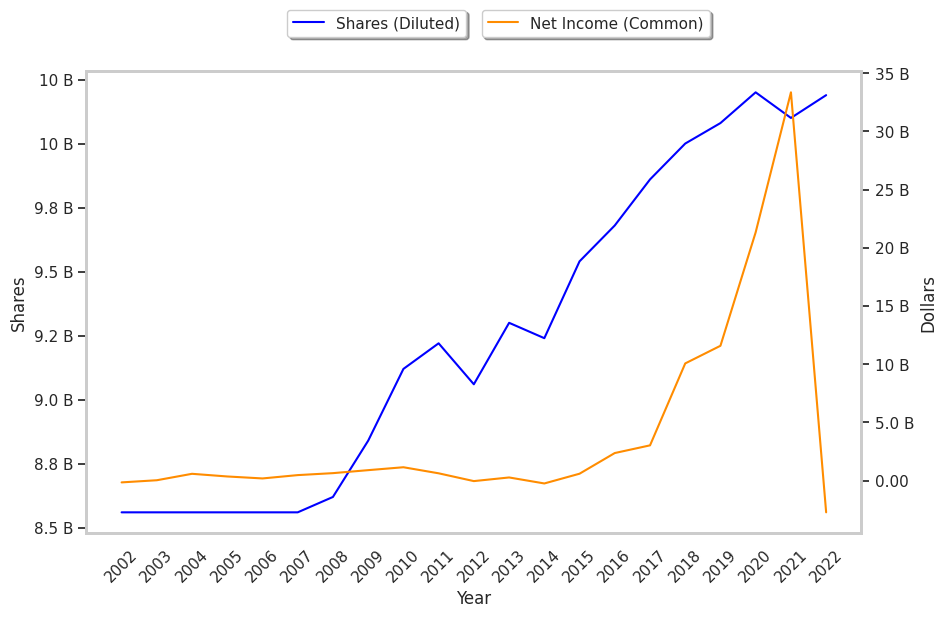
| Net Income (MM) | $3,033 | $10,073 | $11,588 | $21,331 | $33,364 | -$2,722 |
| Net Interest Expense (MM) | -$646 | -$977 | -$768 | -$1,092 | -$1,361 | -$1,378 |
| Depreciation & Amort. (MM) | -$11,478 | -$15,341 | -$21,789 | -$25,180 | -$34,433 | -$41,921 |
| Earnings Per Share | $0.31 | $1.01 | $1.15 | $2.09 | $3.3 | -$0.27 |
| EPS Growth | n/a | 225.81% | 13.86% | 81.74% | 57.89% | -108.18% |
| Diluted Shares (MM) | 9,860 | 10,000 | 10,080 | 10,200 | 10,100 | 10,189 |
| Free Cash Flow (MM) | $28,423 | $42,046 | $51,203 | $106,204 | $107,380 | $110,397 |
| Capital Expenditures (MM) | -$10,058 | -$11,323 | -$12,689 | -$40,140 | -$61,053 | -$63,645 |
| Net Current Assets (MM) | -$43,404 | -$43,998 | -$66,854 | -$95,058 | -$120,724 | -$169,841 |
| Long Term Debt (MM) | $24,743 | $23,495 | $23,414 | $31,816 | $48,744 | $67,150 |
Amazon.com has exceptional EPS growth and a pattern of improving cash flows. Additionally, the company's financial statements display healthy debt levels and wider gross margins than its peer group. However, the firm has weak operating margins with a stable trend. Finally, we note that Amazon.com has weak revenue growth and a flat capital expenditure trend.