We've been asking ourselves recently if the market has placed a fair valuation on Thermo Fisher Scientific. Let's dive into some of the fundamental values of this large-cap Industrials company to determine if there might be an opportunity here for value-minded investors.
Thermo Fisher Scientific Has Elevated P/B and P/E Ratios:
Thermo Fisher Scientific Inc. provides life sciences solutions, analytical instruments, specialty diagnostics, and laboratory products and biopharma services in the United States and internationally. The company belongs to the Industrials sector, which has an average price to earnings (P/E) ratio of 20.49 and an average price to book (P/B) ratio of 3.78. In contrast, Thermo Fisher Scientific has a trailing 12 month P/E ratio of 35.3 and a P/B ratio of 4.55.
Thermo Fisher Scientific's PEG ratio is 3.36, which shows that the stock is probably overvalued in terms of its estimated growth. For reference, a PEG ratio near or below 1 is a potential signal that a company is undervalued.
Wider Gross Margins Than the Industry Average of 34.2%:
| 2018-02-28 | 2019-02-27 | 2020-02-26 | 2021-02-25 | 2022-02-24 | 2023-02-23 | |
|---|---|---|---|---|---|---|
| Revenue (MM) | $20,918 | $24,358 | $25,542 | $32,218 | $39,211 | $44,915 |
| Gross Margins | 45.0% | 45.0% | 44.0% | 50.0% | 50.0% | 42.0% |
| Operating Margins | 15% | 16% | 16% | 24% | 26% | 19% |
| Net Margins | 11.0% | 12.0% | 14.0% | 20.0% | 20.0% | 15.0% |
| Net Income (MM) | $2,222 | $2,938 | $3,696 | $6,375 | $7,725 | $6,950 |
| Net Interest Expense (MM) | n/a | -$530 | -$452 | -$488 | -$493 | -$454 |
| Depreciation & Amort. (MM) | -$2,033 | -$526 | -$2,277 | -$2,325 | -$2,592 | -$3,381 |
| Earnings Per Share | $5.58 | $7.24 | $9.17 | $15.98 | $19.41 | $17.64 |
| EPS Growth | n/a | 29.75% | 26.66% | 74.26% | 21.46% | -9.12% |
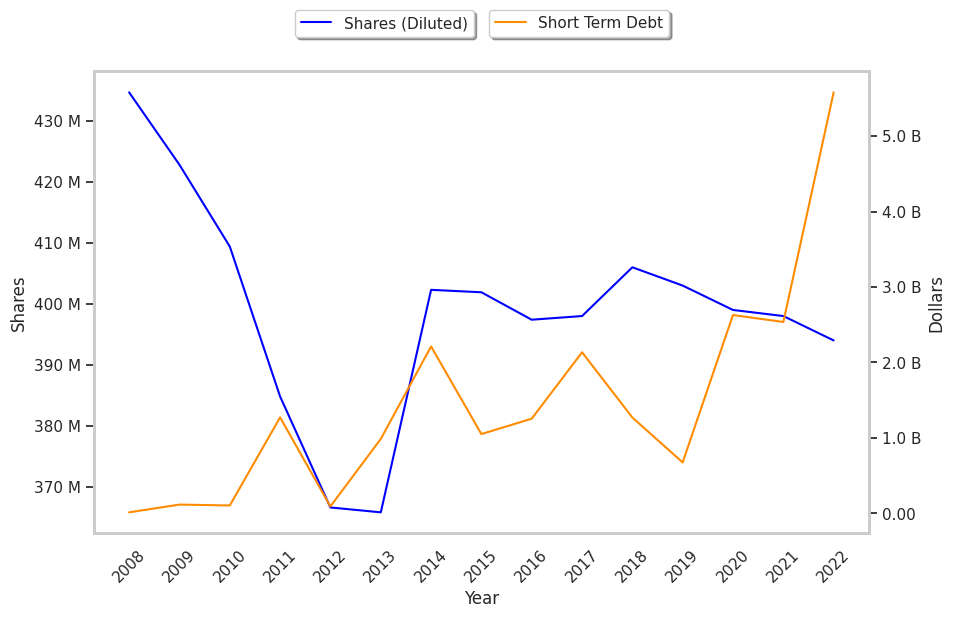
| Diluted Shares (MM) | 398 | 406 | 403 | 399 | 398 | 394 |
| Free Cash Flow (MM) | $4,506 | $5,251 | $5,863 | $9,755 | $11,815 | $11,373 |
| Capital Expenditures (MM) | -$501 | -$708 | -$890 | -$1,466 | -$2,503 | -$2,219 |
| Net Current Assets (MM) | -$21,835 | -$18,021 | -$16,813 | -$12,578 | -$34,033 | -$27,777 |
| Long Term Debt (MM) | $18,873 | $17,719 | $17,076 | $19,107 | $32,333 | $28,909 |
| Net Debt / EBITDA | 3.87 | 3.87 | 2.38 | 1.12 | 2.37 | 2.18 |
Thermo Fisher Scientific has strong margins with a stable trend, wider gross margins than its peer group, and a strong EPS growth trend. Furthermore, Thermo Fisher Scientific has weak revenue growth and a flat capital expenditure trend, irregular cash flows, and just enough current assets to cover current liabilities. In addition, we note significant leverage.