Now trading at a price of $34.03, Williams Companies has moved 0.6% so far today.
Over the last year, Williams Companies logged a 3.0% change, with its stock price reaching a high of $35.46 and a low of $27.8. Over the same period, the stock underperformed the S&P 500 index by -7.0%. As of April 2023, the company's 50-day average price was $34.08. The Williams Companies, Inc., together with its subsidiaries, operates as an energy infrastructure company primarily in the United States. Based in Tulsa, OK, the large-cap Utilities company has 5,043 full time employees. Williams Companies has offered a 5.2% dividend yield over the last 12 months.
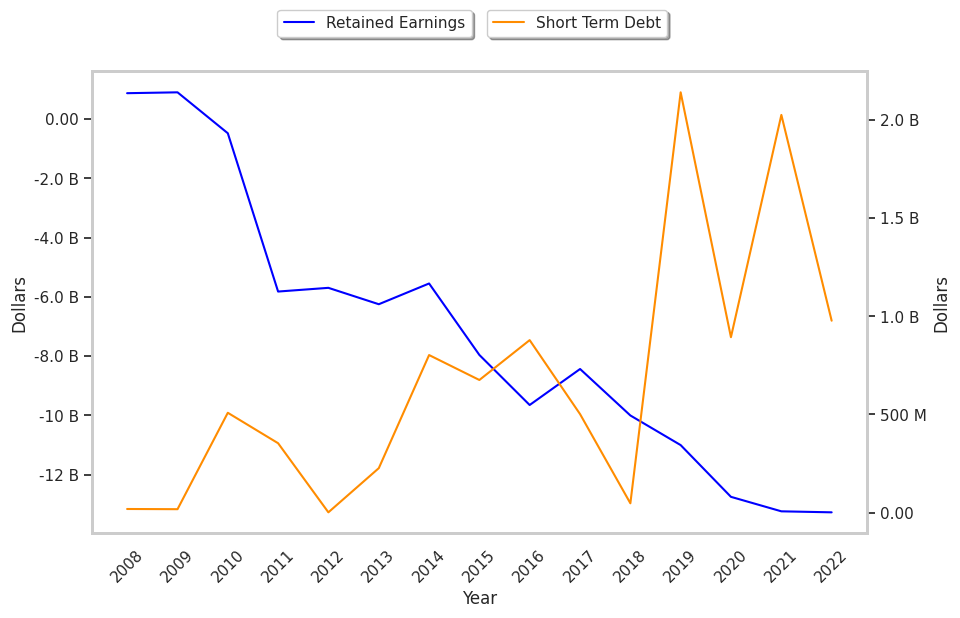
Exceptional Profitability Overshadowed by Excessive Leverage:
| 2018-02-22 | 2019-02-21 | 2020-02-24 | 2021-02-24 | 2022-02-28 | 2023-02-27 | |
|---|---|---|---|---|---|---|
| Revenue (MM) | $8,031 | $8,686 | $8,201 | $7,719 | $10,627 | $10,965 |
| Gross Margins | 71.0% | 69.0% | 76.0% | 79.0% | 62.0% | 68.0% |
| Operating Margins | 13% | 23% | 28% | 33% | 25% | 28% |
| Net Margins | 27.0% | -2.0% | 10.0% | 3.0% | 14.0% | 19.0% |
| Net Income (MM) | $2,174 | -$155 | $850 | $211 | $1,517 | $2,049 |
| Net Interest Expense (MM) | -$1,083 | -$1,112 | -$1,186 | -$1,172 | -$1,179 | -$1,147 |
| Depreciation & Amort. (MM) | -$1,736 | -$1,725 | -$1,714 | -$1,721 | -$1,842 | -$2,009 |
| Earnings Per Share | $2.62 | -$0.16 | $0.7 | $0.17 | $1.24 | $1.68 |
| EPS Growth | n/a | -106.11% | 537.5% | -75.71% | 629.41% | 35.48% |
| Diluted Shares (MM) | 829 | 974 | 1,214 | 1,215 | 1,218 | 1,218 |
| Free Cash Flow (MM) | $5,179 | $6,556 | $5,842 | $4,771 | $5,192 | $7,172 |
| Capital Expenditures (MM) | -$2,440 | -$3,263 | -$2,149 | -$1,275 | -$1,247 | -$2,283 |
| Net Current Assets (MM) | -$27,998 | -$27,841 | -$28,096 | -$28,154 | -$28,962 | -$30,591 |
| Long Term Debt (MM) | $20,434 | $22,367 | $20,148 | $21,451 | $21,650 | $21,927 |
| Net Debt / EBITDA | 7.12 | 5.99 | 5.35 | 5.17 | 4.92 | 4.53 |
A Very Low P/E Ratio but Trades Above Its Graham Number:
Williams Companies has a trailing twelve month P/E ratio of 15.3, compared to an average of 22.89 for the Utilities sector. Based on its EPS guidance of $1.84, the company has a forward P/E ratio of 18.5. The company doesn't issue forward earnings guidance, and the compound average growth rate of its last 6 years of reported EPS is -2.7%. On this basis, the company's PEG ratio is -5.77, which indicates that its shares are overpriced. Furthermore, Williams Companies is likely overvalued compared to the book value of its equity, since its P/B ratio of 3.56 is higher than the sector average of 1.03. The company's shares are currently trading 63.0% above their Graham number.
Williams Companies Has an Average Rating of Buy:
The 19 analysts following Williams Companies have set target prices ranging from $31.0 to $42.0 per share, for an average of $37.55 with a buy rating. As of April 2023, the company is trading -9.2% away from its average target price, indicating that there is an analyst consensus of some upside potential.
Williams Companies has an average amount of shares sold short because 2.4% of the company's shares are sold short. Institutions own 87.5% of the company's shares, and the insider ownership rate stands at 0.36%, suggesting a small amount of insider investors. The largest shareholder is Vanguard Group Inc, whose 11% stake in the company is worth $4,377,759,046.