Foot Locker may be undervalued with mixed growth prospects, but the 17 analysts following the company give it an rating of hold. Their target prices range from $11.0 to $30.0 per share, for an average of $20.53. At today's price of $17.68, Foot Locker is trading -13.88% away from its average target price, suggesting there is an analyst consensus of some upside potential for the stock.
Foot Locker, Inc., through its subsidiaries, operates as a footwear and apparel retailer in North America, Europe, Australia, New Zealand, Asia, and the Middle East. Based in New York, NY, the mid-cap Consumer Discretionary company has 15,200 full time employees. Foot Locker has provided a 9.0% dividend yield over the last 12 months.
Foot Locker has a trailing twelve month P/E ratio of 11.4, compared to an average of 22.33 for the Consumer Discretionary sector. Considering its EPS guidance of $2.14, the company has a forward P/E ratio of 8.3.
The average compound growth rate of the company's last 6 years of reported earnings per share is -17.5% (the company doesn't issue forward EPS guidance). On this basis, the company's PEG ratio is -0.88, which indicates that its shares are overpriced.
On the other hand, the market is potentially undervaluing Foot Locker in terms of its book value because its P/B ratio is 0.51. In comparison, the sector average P/B ratio is 3.12. The company's shares are currently -77.2% below their Graham number, indicating that its shares have a margin of safety.
So why does Foot Locker get a bad rating from most analysts despite its seemingly attractive valuation? One reason could be its worrying EPS growth rate of -17.5%.
| 2017-03-23 | 2018-03-29 | 2019-04-02 | 2020-03-27 | 2021-03-25 | 2022-03-24 | |
|---|---|---|---|---|---|---|
| Revenue (MM) | $7,766 | $7,782 | $7,939 | $8,005 | $7,548 | $8,958 |
| Gross Margins | 34.0% | 32.0% | 32.0% | 32.0% | 28.0% | 34.0% |
| Operating Margins | 13% | 7% | 9% | 9% | 6% | 12% |
| Net Margins | 9.0% | 4.0% | 7.0% | 6.0% | 4.0% | 10.0% |
| Net Income (MM) | $664 | $284 | $541 | $491 | $323 | $891 |
| Net Interest Expense (MM) | -$2 | $2 | $9 | $11 | -$7 | -$14 |
| Depreciation & Amort. (MM) | -$158 | -$173 | -$178 | -$179 | -$176 | -$197 |
| Earnings Per Share | $4.91 | $2.22 | $4.66 | $4.5 | $3.07 | $8.58 |
| EPS Growth | n/a | -54.79% | 109.91% | -3.43% | -31.78% | 179.48% |
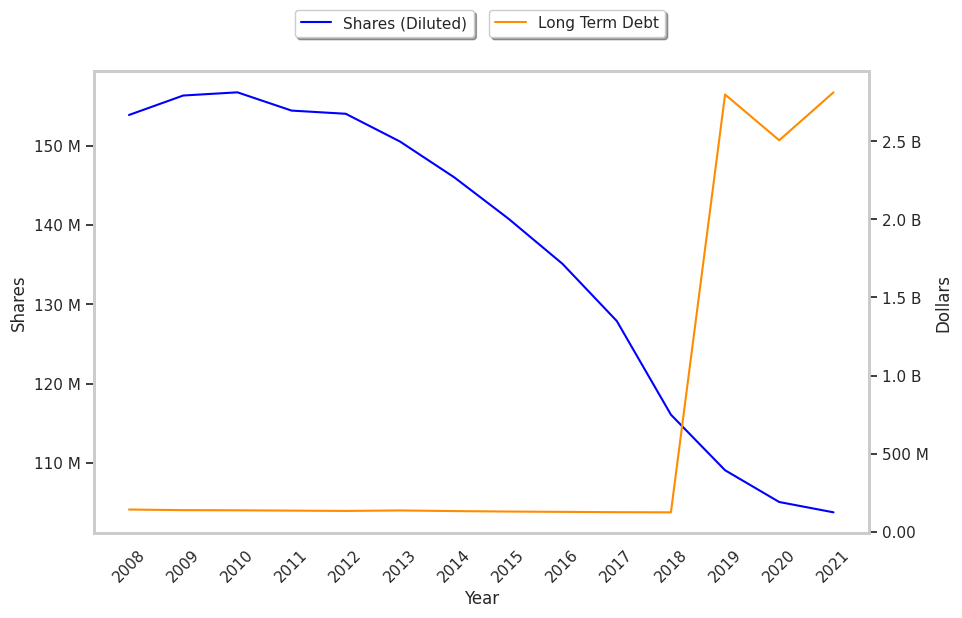
| Diluted Shares (MM) | 135 | 128 | 116 | 109 | 105 | 104 |
| Free Cash Flow (MM) | $1,110 | $1,087 | $966 | $881 | $1,221 | $872 |
| Capital Expenditures (MM) | -$266 | -$274 | -$185 | -$185 | -$159 | -$206 |
| Net Current Assets (MM) | $1,503 | $1,109 | $1,204 | -$1,730 | -$1,432 | -$2,529 |
| Long Term Debt (MM) | $127 | $125 | $124 | $2,800 | $2,507 | $2,814 |
| Net Debt / EBITDA | -0.79 | -0.97 | -0.84 | 2.12 | 2.53 | 2.11 |