Jefferies Financial logged a 0.8% change during today's morning session, and is now trading at a price of $36.67 per share.
Jefferies Financial returned gains of 18.0% last year, with its stock price reaching a high of $40.68 and a low of $27.5. Over the same period, the stock outperformed the S&P 500 index by 3.0%. More recently, the company's 50-day average price was $35.34. Jefferies Financial Group Inc. engages in the investment banking and capital markets, and asset management businesses in the Americas, Europe, the Middle East, and Asia. Based in New York, NY, the mid-cap Finance company has 5,335 full time employees. Jefferies Financial has offered a 3.3% dividend yield over the last 12 months.
The Company Has a Positive Net Current Asset Value:
| 2018-02-27 | 2019-01-29 | 2020-01-29 | 2021-01-08 | 2022-01-28 | 2023-01-27 | |
|---|---|---|---|---|---|---|
| Revenue (MM) | $12,408 | $5,010 | $5,359 | $5,851 | $8,014 | $5,979 |
| Operating Margins | 9% | 31% | 34% | 19% | 28% | 20% |
| Net Margins | 1.0% | 20.0% | 18.0% | 13.0% | 21.0% | 13.0% |
| Net Income (MM) | $172 | $1,027 | $965 | $775 | $1,674 | $785 |
| Earnings Per Share | $0.4 | $2.61 | $2.89 | $2.7 | $5.89 | $2.95 |
| EPS Growth | n/a | 552.5% | 10.73% | -6.57% | 118.15% | -49.92% |
| Diluted Shares (MM) | 414 | 392 | 332 | 285 | 283 | 264 |
| Free Cash Flow (MM) | $883 | $1,003 | -$596 | $2,232 | $1,748 | $2,029 |
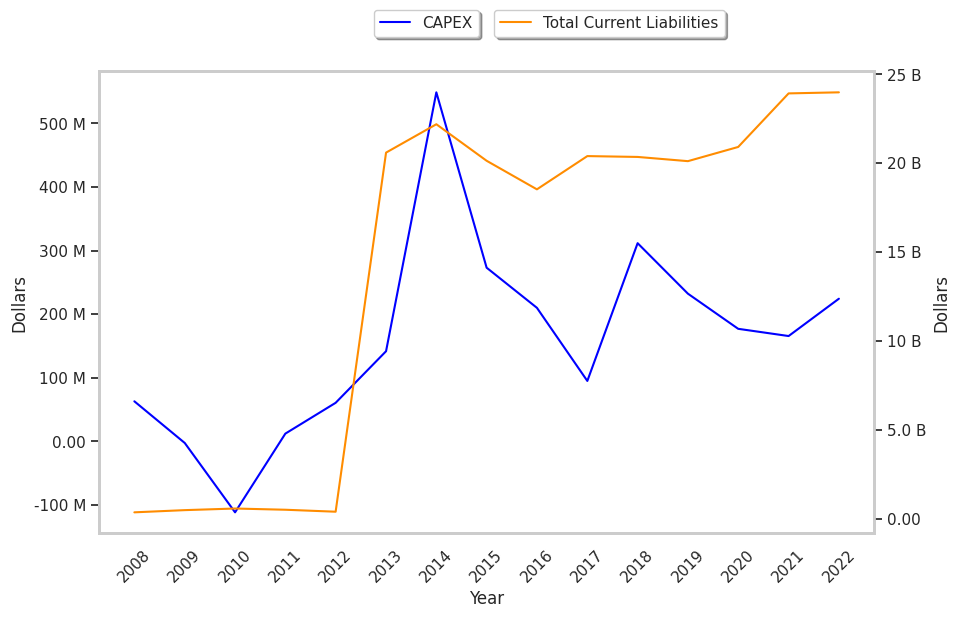
| Capital Expenditures (MM) | -$95 | -$312 | -$232 | -$177 | -$166 | -$224 |
| Net Current Assets (MM) | -$30,625 | -$30,940 | -$31,231 | -$9,137 | $6,950 | $5,165 |
| Long Term Debt (MM) | $8,915 | $9,152 | $11,408 | $11,640 | $13,738 | $10,937 |
| Net Debt / EBITDA | 3.53 | 2.61 | 2.18 | -11.59 | -8.46 | -16.29 |
Jefferies Financial has exceptional EPS growth, low leverage, and decent operating margins with a positive growth rate. Furthermore, Jefferies Financial has weak revenue growth and a flat capital expenditure trend, irregular cash flows, and a decent current ratio.
Trades Below Its Graham Number but Has an Elevated P/E Ratio:
Jefferies Financial has a trailing twelve month P/E ratio of 18.0, compared to an average of 14.34 for the Finance sector. Based on its EPS guidance of $3.7, the company has a forward P/E ratio of 9.6. The company doesn't provide forward earnings guidance, and the compound average growth rate of its last 6 years of reported EPS is 30.3%. On this basis, Jefferies Financial's PEG ratio is 0.59. Using instead the 10.8% weighted average of Jefferies Financial's earnings CAGR and the broader market's anticipated 5-year EPS growth rate, the company's PEG ratio is 1.67, which suggests that its shares may be overpriced. In contrast, the market is likely undervaluing Jefferies Financial in terms of its equity because its P/B ratio is 0.88 while the sector average is 1.57. The company's shares are currently trading -35.7% below their Graham number. In conclusion, Jefferies Financial's impressive cash flow trend, decent P/B ratio, and reasonable use of leverage demonstrate that the company may still be fairly valued — despite its elevated earnings multiple.
Jefferies Financial Has an Analyst Consensus of Some Upside Potential:
The 3 analysts following Jefferies Financial have set target prices ranging from $36.0 to $43.0 per share, for an average of $39.67 with a buy rating. As of April 2023, the company is trading -10.9% away from its average target price, indicating that there is an analyst consensus of some upside potential.
Jefferies Financial has an average amount of shares sold short because 4.1% of the company's shares are sold short. Institutions own 64.8% of the company's shares, and the insider ownership rate stands at 24.53%, suggesting a large amount of insider shareholders. The largest shareholder is Vanguard Group Inc, whose 9% stake in the company is worth $758,043,852.