We've been asking ourselves recently if the market has placed a fair valuation on Ventas. Let's dive into some of the fundamental values of this large-cap Real Estate company to determine if there might be an opportunity here for value-minded investors.
Ventas Has an Attractive P/B Ratio but a Worrisome P/E Ratio:
Ventas Inc., an S&P 500 company, operates at the intersection of two large and dynamic industries healthcare and real estate. The company belongs to the Real Estate sector, which has an average price to earnings (P/E) ratio of 24.81 and an average price to book (P/B) ratio of 2.24. In contrast, Ventas has a trailing 12 month P/E ratio of 197.0 and a P/B ratio of 1.74.
When we divide Ventas's P/E ratio by its expected EPS growth rate of the next five years, we obtain its PEG ratio of -9.93. Since it's negative, the company has negative growth expectations, and most investors will probably avoid the stock unless it has an exceptionally low P/E and P/B ratio.
Shareholders Are Confronted With a Declining EPS Growth Trend:
| 2018-02-09 | 2019-02-08 | 2020-02-24 | 2021-02-23 | 2022-02-18 | 2023-02-10 | |
|---|---|---|---|---|---|---|
| Revenue (MM) | $3,574 | $3,746 | $3,873 | $3,795 | $3,828 | $4,129 |
| Operating Margins | 30% | 26% | 22% | 16% | 10% | 11% |
| Net Margins | 38.0% | 11.0% | 11.0% | 12.0% | 1.0% | -1.0% |
| Net Income (MM) | $1,356 | $409 | $433 | $439 | $49 | -$47 |
| Net Interest Expense (MM) | -$448 | -$442 | -$452 | -$470 | -$440 | -$468 |
| Depreciation & Amort. (MM) | -$888 | -$920 | -$1,046 | -$1,110 | -$1,197 | -$1,198 |
| Earnings Per Share | $3.78 | $1.14 | $1.17 | $1.17 | $0.13 | -$0.13 |
| EPS Growth | n/a | -69.84% | 2.63% | 0.0% | -88.89% | -200.0% |
| Diluted Shares (MM) | 359 | 359 | 370 | 377 | 386 | 377 |
| Free Cash Flow (MM) | $1,665 | $1,756 | $2,809 | $1,013 | $1,988 | $1,908 |
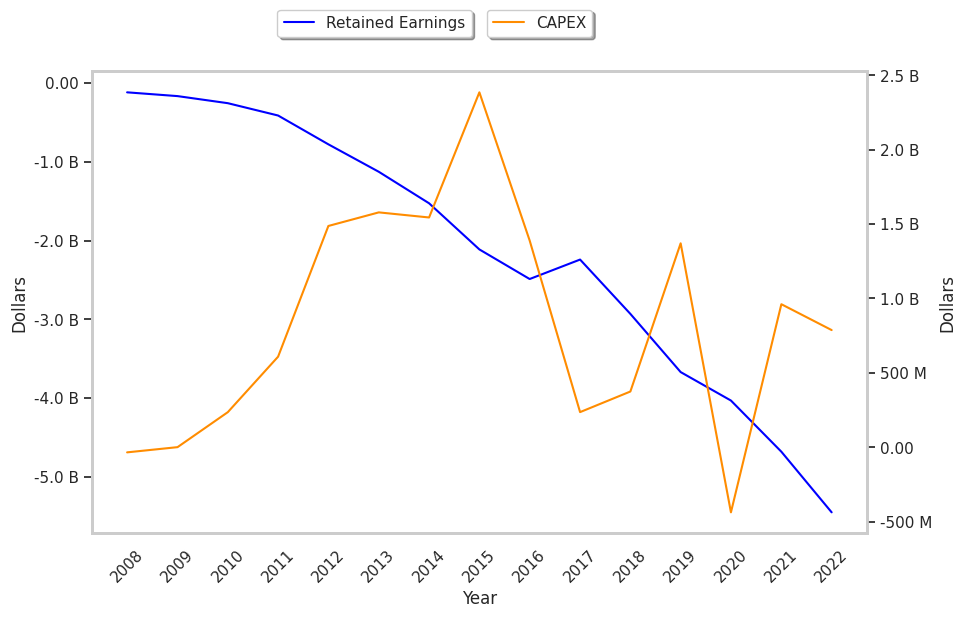
| Capital Expenditures (MM) | -$236 | -$375 | -$1,371 | $437 | -$962 | -$788 |
| Net Current Assets (MM) | -$12,610 | -$11,988 | -$13,727 | -$12,964 | -$12,977 | -$13,190 |
| Long Term Debt (MM) | $11,276 | $10,734 | $12,159 | $11,895 | $12,028 | $12,297 |
Ventas has weak revenue growth and a flat capital expenditure trend, irregular cash flows, and an average amount of debt. Furthermore, the firm suffers from weak operating margins with a negative growth trend and declining EPS growth.