Comerica shares fell by -2.5% during the day's afternoon session, and are now trading at a price of $44.33. Is it time to buy the dip? To better answer that question, it's essential to check if the market is valuing the company's shares fairly in terms of its earnings and equity levels.
Comerica Has Attractive Multiples and Trades Below Its Graham Number:
Comerica Incorporated, through its subsidiaries, provides various financial products and services. The company belongs to the Finance sector, which has an average price to earnings (P/E) ratio of 14.34 and an average price to book (P/B) ratio of 1.57. In contrast, Comerica has a trailing 12 month P/E ratio of 4.6 and a P/B ratio of 1.12.
When we divide Comerica's P/E ratio by its expected EPS growth rate of the next five years, we obtain its PEG ratio of -0.56. Since it's negative, the company has negative growth expectations, and most investors will probably avoid the stock unless it has an exceptionally low P/E and P/B ratio.
The Business Runs With Low Debt Levels:
| 2018-02-15 | 2019-02-12 | 2020-02-11 | 2021-02-09 | 2022-02-16 | 2023-02-14 | |
|---|---|---|---|---|---|---|
| Revenue (MM) | $3,168 | $3,328 | $3,349 | $2,912 | $2,967 | $3,534 |
| Operating Margins | 40% | 48% | 46% | 21% | 50% | 42% |
| Net Margins | 23% | 37% | 36% | 17% | 39% | 33% |
| Net Income (MM) | $743 | $1,235 | $1,202 | $497 | $1,168 | $1,151 |
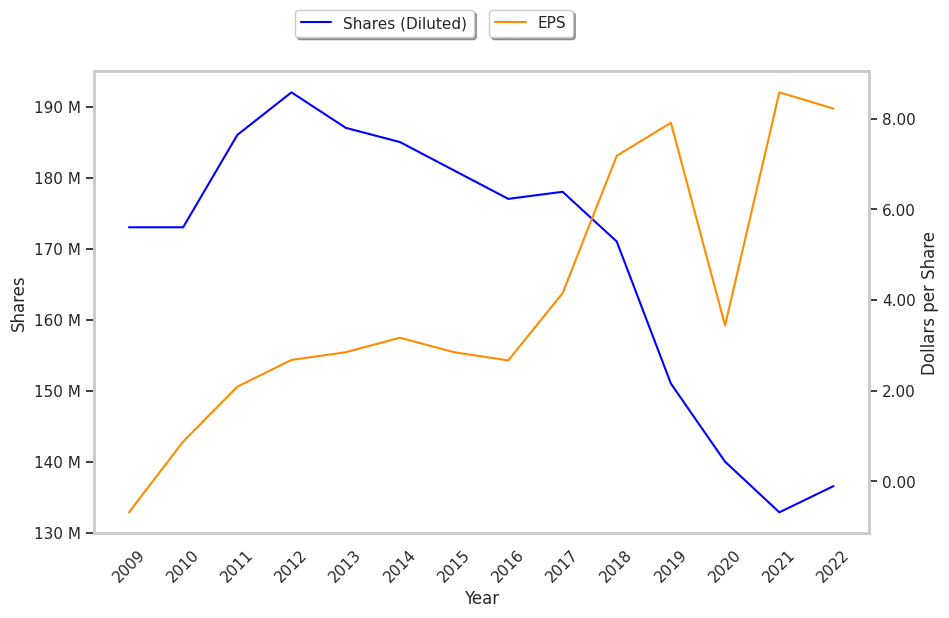
| Earnings Per Share | $4.15 | $7.18 | $7.91 | $3.44 | $8.58 | $8.22 |
| EPS Growth | n/a | 73.01% | 10.17% | -56.51% | 149.42% | -4.2% |
| Diluted Shares (MM) | 178 | 171 | 151 | 140 | 133 | 137 |
| Free Cash Flow (MM) | $1,132 | $1,698 | $1,175 | $1,002 | $696 | $717 |
| Capital Expenditures (MM) | -$47 | -$82 | -$85 | -$74 | -$62 | -$79 |
| Long Term Debt (MM) | $4,622 | $6,463 | $7,269 | $5,728 | $2,796 | $3,024 |
Comerica has weak revenue growth and a flat capital expenditure trend, average net margins with a stable trend, and irregular cash flows. We also note that the company benefits from low debt levels and a strong EPS growth trend. Furthermore, Comerica's financial statements do not display any obvious red flags.