Now trading at a price of $52.47, Corteva has moved 1.6% so far today.
Corteva returned losses of -17.0% last year, with its stock price reaching a high of $68.43 and a low of $48.68. Over the same period, the stock underperformed the S&P 500 index by -32.0%. As of April 2023, the company's 50-day average price was $53.31. Corteva, Inc. operates in the agriculture business. Based in Indianapolis, IN, the large-cap Industrials company has 21,000 full time employees. Corteva has offered a 1.2% dividend yield over the last 12 months.
Low Leverage Levels and Exceptional EPS Growth:
| 2020-02-14 | 2021-02-11 | 2022-02-10 | 2023-02-09 | |
|---|---|---|---|---|
| Revenue (MM) | $13,846 | $14,217 | $15,655 | $17,455 |
| Gross Margins | 38.0% | 40.0% | 41.0% | 40.0% |
| Operating Margins | 4% | 6% | 8% | 11% |
| Net Margins | -7.0% | 5.0% | 11.0% | 7.0% |
| Net Income (MM) | -$1,030 | $681 | $1,759 | $1,147 |
| Net Interest Expense (MM) | -$242 | -$45 | -$30 | -$79 |
| Depreciation & Amort. (MM) | -$1,599 | -$1,243 | -$1,243 | -$1,223 |
| Earnings Per Share | -$1.37 | $0.91 | $2.4 | $1.56 |
| EPS Growth | n/a | 166.42% | 163.74% | -35.0% |
| Diluted Shares (MM) | 750 | 751 | 734 | 734 |
| Free Cash Flow (MM) | $2,159 | $3,300 | $3,262 | $1,477 |
| Capital Expenditures (MM) | -$1,163 | -$573 | -$573 | -$605 |
| Net Current Assets (MM) | -$8,350 | -$6,280 | -$1,175 | -$282 |
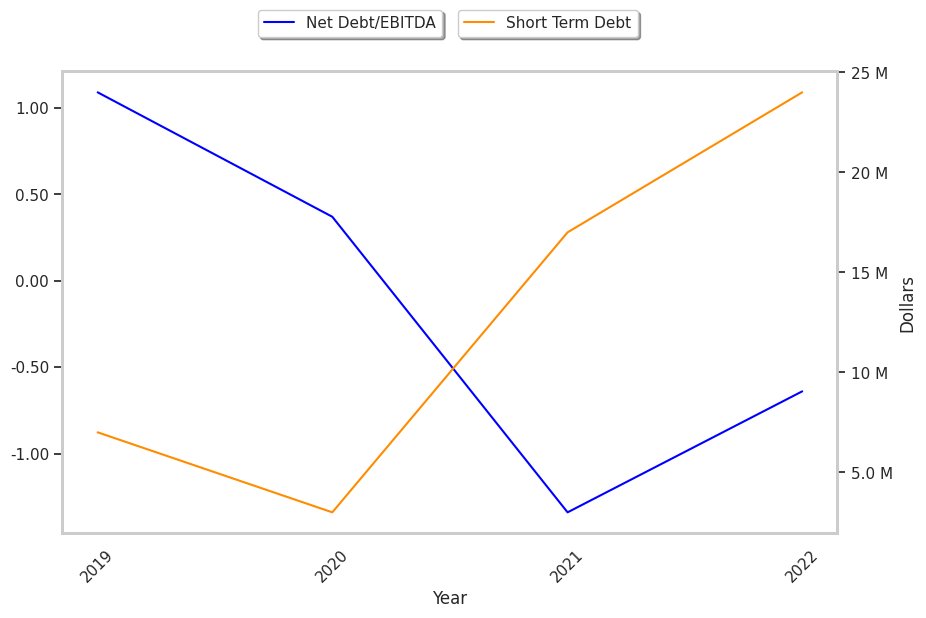
| Long Term Debt (MM) | $4,136 | $4,561 | $1,100 | $1,283 |
| Net Debt / EBITDA | 1.09 | 0.37 | -1.34 | -0.64 |
Corteva has exceptional EPS growth, low leverage, and wider gross margins than its peer group. However, the firm has weak operating margins with a positive growth rate. Finally, we note that Corteva has weak revenue growth and a flat capital expenditure trend, irregular cash flows, and a decent current ratio.
A Lower P/B Ratio Than Its Sector Average but Trades Above Its Graham Number:
Corteva has a trailing twelve month P/E ratio of 34.0, compared to an average of 20.49 for the Industrials sector. Based on its EPS guidance of $3.3, the company has a forward P/E ratio of 16.2. Corteva's PEG ratio is 3.3 on the basis of the 10.3% weighted average of the company and the broader market's EPS compound average growth rates. This suggests that the company's shares are overvalued. In contrast, the market is likely undervaluing Corteva in terms of its equity because its P/B ratio is 1.42 while the sector average is 3.78. The company's shares are currently trading 50.1% above their Graham number. In conclusion, Corteva's impressive cash flow trend, decent P/B ratio, and reasonable use of leverage demonstrate that the company may still be fairly valued — despite its elevated earnings multiple.
Corteva Has an Average Rating of Buy:
The 22 analysts following Corteva have set target prices ranging from $57.0 to $82.0 per share, for an average of $69.66 with a buy rating. As of April 2023, the company is trading -23.5% away from its average target price, indicating that there is an analyst consensus of strong upside potential.
Corteva has a very low short interest because 0.8% of the company's shares are sold short. Institutions own 82.9% of the company's shares, and the insider ownership rate stands at 0.15%, suggesting a small amount of insider investors. The largest shareholder is Vanguard Group Inc, whose 11% stake in the company is worth $4,166,014,868.