Jones Lang LaSalle logged a -7.4% change during today's evening session, and is now trading at a price of $156.12 per share.
Jones Lang LaSalle returned losses of -6.0% last year, with its stock price reaching a high of $188.61 and a low of $123.0. Over the same period, the stock underperformed the S&P 500 index by -21.0%. As of April 2023, the company's 50-day average price was $167.33. Jones Lang LaSalle Incorporated, a professional services company, provides real estate and investment management services in Americas, Europe, the Middle East, Africa, and the Asia Pacific. Based in Chicago, IL, the mid-cap Finance company has 103,300 full time employees. Jones Lang LaSalle has not offered a dividend during the last year.
The Business Runs With Low Leverage Levels:
| 2018-02-23 | 2019-02-26 | 2020-02-27 | 2021-02-18 | 2022-02-28 | 2023-02-28 | |
|---|---|---|---|---|---|---|
| Revenue (MM) | $7,932 | $16,318 | $17,983 | $16,590 | $19,367 | $20,862 |
| Interest Income (MM) | -$56 | -$51 | -$56 | -$53 | -$40 | -$75 |
| Operating Margins | 7% | 5% | 5% | 4% | 6% | 5% |
| Net Margins | 3.0% | 3.0% | 3.0% | 2.0% | 5.0% | 3.0% |
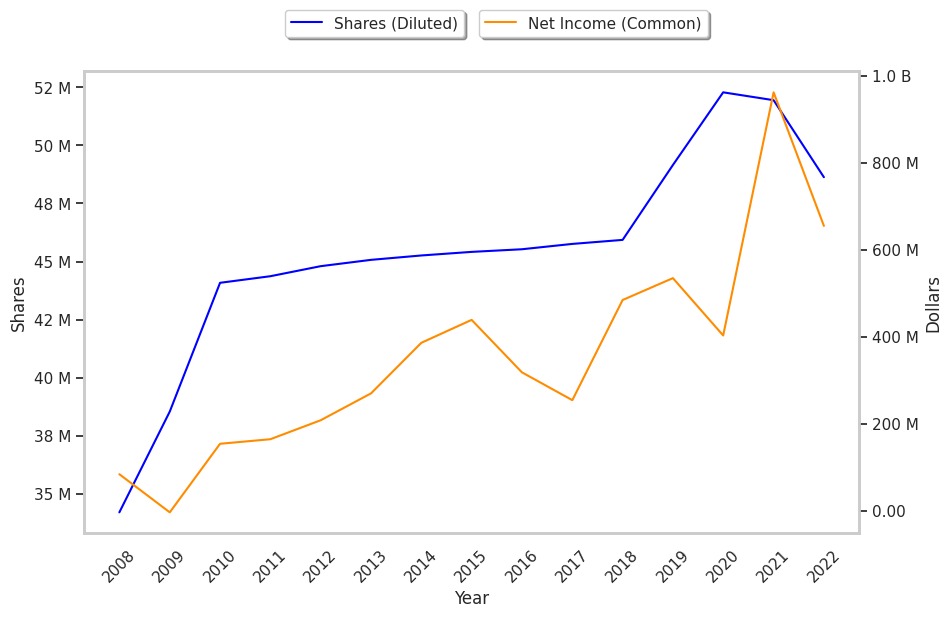
| Net Income (MM) | $254 | $484 | $535 | $402 | $962 | $654 |
| Depreciation & Amort. (MM) | -$167 | -$186 | -$202 | -$226 | -$218 | -$228 |
| Earnings Per Share | $5.55 | $10.54 | $10.87 | $7.7 | $18.51 | $13.46 |
| EPS Growth | n/a | 89.91% | 3.13% | -29.16% | 140.39% | -27.28% |
| Diluted Shares (MM) | 46 | 46 | 49 | 52 | 52 | 49 |
| Free Cash Flow (MM) | $792 | $714 | $672 | $1,264 | $1,148 | $406 |
| Capital Expenditures (MM) | -$2 | -$110 | -$188 | -$149 | -$176 | -$206 |
| Net Current Assets (MM) | -$1,331 | -$1,085 | -$2,591 | -$2,245 | -$2,696 | -$2,874 |
| Long Term Debt (MM) | $675 | $656 | $1,177 | $693 | $534 | $1,587 |
| Net Debt / EBITDA | 0.66 | 0.22 | 0.77 | 0.2 | 0.38 | 1.16 |
Jones Lang LaSalle has weak revenue growth and a flat capital expenditure trend, weak operating margings with a negative growth trend, and irregular cash flows. In addition, we note just enough current assets to cover current liabilities. We also note that the company benefits from low leverage and positive EPS growth. Furthermore, Jones Lang LaSalle's financial statements do not display any obvious red flags.
Trades Below Its Graham Number but Has an Elevated P/E Ratio:
Jones Lang LaSalle has a trailing twelve month P/E ratio of 26.2, compared to an average of 14.34 for the Finance sector. Based on its EPS guidance of $15.1, the company has a forward P/E ratio of 11.1. The company doesn't issue forward earnings guidance, and the compound average growth rate of its last 6 years of reported EPS is 2.4%. On this basis, the company's PEG ratio is 11.02, which suggests that it is overpriced. In contrast, the market is likely undervaluing Jones Lang LaSalle in terms of its equity because its P/B ratio is 1.23 while the sector average is 1.57. The company's shares are currently trading -20.2% below their Graham number. In conclusion, Jones Lang LaSalle's impressive cash flow trend, decent P/B ratio, and reasonable use of leverage demonstrate that the company may still be fairly valued — despite its elevated earnings multiple.
There's an Analyst Consensus of Strong Upside Potential for Jones Lang LaSalle:
The 5 analysts following Jones Lang LaSalle have set target prices ranging from $167.0 to $222.0 per share, for an average of $198.4 with a buy rating. As of April 2023, the company is trading -15.7% away from its average target price, indicating that there is an analyst consensus of strong upside potential.
Jones Lang LaSalle has an average amount of shares sold short because 4.4% of the company's shares are sold short. Institutions own 98.1% of the company's shares, and the insider ownership rate stands at 0.76%, suggesting a small amount of insider investors. The largest shareholder is Vanguard Group Inc, whose 15% stake in the company is worth $1,079,939,458.